Published by:
CGP EDU Academic Team
Published on: August 11, 2026
The graphical representation of population growth curve i: given below.
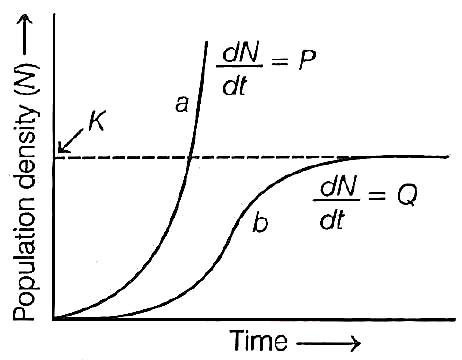
Identify  and
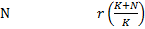
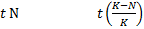
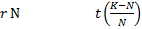
and  from the following.


A
B

C
D
Text Solution
Verified by ExpertsThe correct answer is:
B
The graph shows the population growth curve in which population density  is plothed with respect to time (t).
Here '  ' shows condition when the responses are not limiting the growth and the plot is exponential. It is described as
'b' shows the condition when responses are limiting the growth and plot is logistic. It is described as  .
.
Prepare Smarter with CGP Edu
Get practice questions, solutions, and test series in one place.
Write a Review
Share your experience with this question and solution.
Commentary
Send your comment, doubt, correction, or feedback to admin.
Similar Questions
Explore conceptually related problems
Physics
A function is expressed as , where and stand for position and time. The dimensional form…
A physical quantity is given by . The percentage error in measurement of and are and respectiv…
The instantaneous position of particle is given by . Acceleration of motion is
The velocity-time graph for the vertical component of the velocity of a body thrown upward from the…
A truck starts from rest accelerates uniformly at 2 . At , a stone is dropped by a person standin…
A particle is moving with a velocity of . Find the ratio of tangential acceleration to that of ce…