Published by:
CGP EDU Academic Team
Published on: August 12, 2026
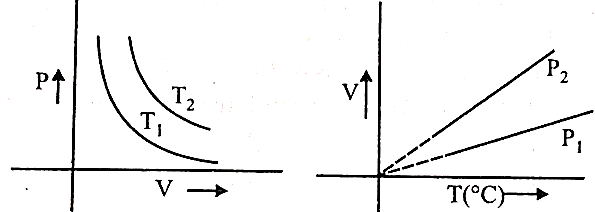
From the following plots, find the correct option
A

B

C

D

Text Solution
Verified by ExpertsThe correct answer is:
D
In plot (I): Higher the curvature higher is the temperature. 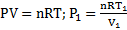 and
and 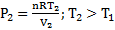 In plot(II):
 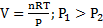 Higher pressure lower is the slope.
Prepare Smarter with CGP Edu
Get practice questions, solutions, and test series in one place.
Write a Review
Share your experience with this question and solution.
Commentary
Send your comment, doubt, correction, or feedback to admin.
Similar Questions
Explore conceptually related problems
At , an ideal gas present in a flask has a concentration of . At the same temperature, 0.1 mole…
At , a gaseous mixture of and containing (weight/weight) of exerts a total pressure of 2 bar. …
The following data is obtained for one mole of a gas The gas behaves as an ideal gas in the pressur…
The vapors of of an element occupy exerting a pressure of at . What is the molar mass (in ) of…
A gas obeys Charles law in the temperature range 0-500 at a given pressure. Its volume changes to …
At , an ideal gas present in flask exerted a pressure of . Its concentration is . What is the …