Published by:
CGP EDU Academic Team
Published on: August 14, 2026
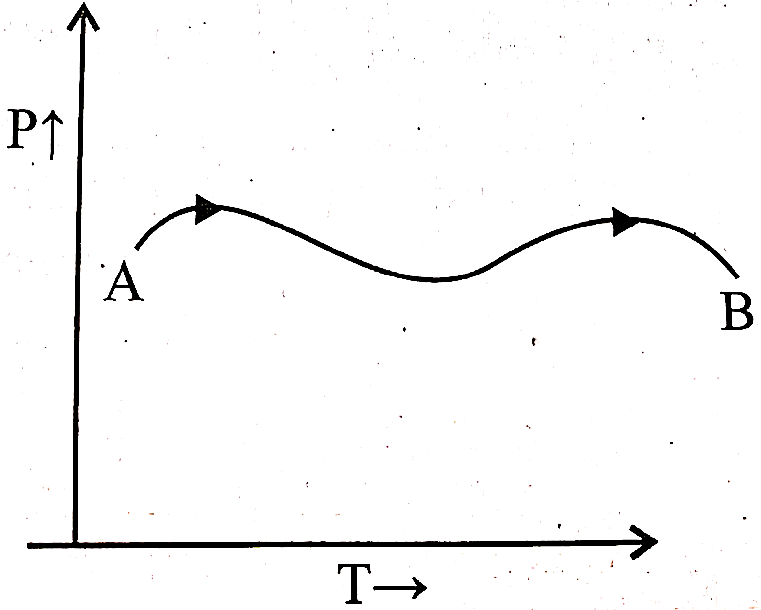
The P-T graph, as given below, was observed for a process on an ideal gas. Which of the
following statement is true:
A

B

C

D

Text Solution
Verified by ExpertsThe correct answer is:
C
In this graph temperature change is positive, then enthalpy change will also be positive.
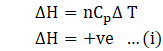
As we know, 
i.e. if temperature increases volume of gas will also be increased.
 …(ii)
…(ii)
from (i) and (ii), option c is correct.
Prepare Smarter with CGP Edu
Get practice questions, solutions, and test series in one place.
Write a Review
Share your experience with this question and solution.
Commentary
Send your comment, doubt, correction, or feedback to admin.
Similar Questions
Explore conceptually related problems
Which of the following is correct for adiabatic expansion of ideal gas?
The molar enthalpy of vaporization of at its boiling point (353 K) is . The
molar internal energy…
Given the bond dissociation enthalpy of bond as and the enthalpy of
formation of is - , find th…
Calculate the enthalpy change (in kcal) for the reaction-
The average bond enthalpy is , first I…
The bond dissociation energies for and ICl are respectively.
The enthalpy of sublimation of iodin…
The enthalpy change for the reaction, is -869.6 kJ. The dissociation energy of
bond is: