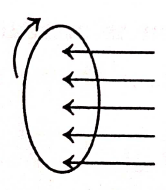
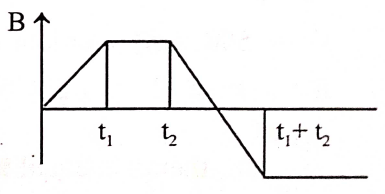
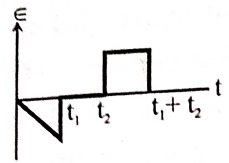
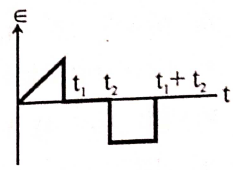
A wire loop is placed in a region of time varying magnetic field which is oriented orthogonally to the plane of the loop as shown in the figure. The graph shows the magnetic field variation as the function of time. Assume the positive emf is the one which drives a current in the clockwise direction and seen by the observer in the direction of  . Which of the following graphs best represents the induced emf
  as a function of time
  .
.
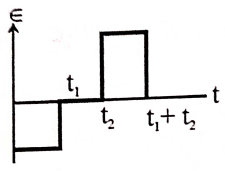
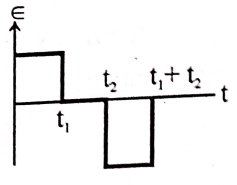
Text Solution
Verified by ExpertsC
From 0 to  where
where  constant
 constant &
negative
From  to
to 
 where
where  constant
 as
as 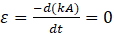
From  to
to  where
where  constant
 constant &
positive
From  where
where  constant
  as
as 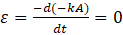
Prepare Smarter with CGP Edu
Get practice questions, solutions, and test series in one place.
Write a Review
Share your experience with this question and solution.
Commentary
Send your comment, doubt, correction, or feedback to admin.
Similar Questions
Explore conceptually related problems