Published by:
CGP EDU Academic Team
Published on: August 14, 2026
The probability density plots of  and
and  -orbitals are given in figure. The density of dots in a region represents the probability density of finding electrons in the region.
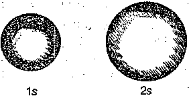
On the basis of above diagram which of the following statements is incorrect?
A
 and 2s-orbitals are spherical in shape.
 B
The probability of finding the electron is maximum near the nucleus.
C
The probability of finding the electron at a given distance is equal in all directions.
D
The probability density of electrons in 2s -orbital decreases uniformly as distance from the nucleus increases.
Text Solution
Verified by ExpertsThe correct answer is:
D
The probability density of electrons in 2s -orbital first increases then decreases and after that it begins to increase again as distance increases from nucleus.
Prepare Smarter with CGP Edu
Get practice questions, solutions, and test series in one place.
Write a Review
Share your experience with this question and solution.
Commentary
Send your comment, doubt, correction, or feedback to admin.
Similar Questions
Explore conceptually related problems
A photon of 300 nm is absorbed by a gas and then emits two photons. One photon has a wavelength of …
The energy required to remove an electron from metal is . Calculate the maximum wavelength of lig…
A certain dye absorbs light of and then fluorescences light of .
Assuming that under given condit…
The ratio of the energy of a photon of wavelength to that of a photon of wavelength is
Light of wavelength falls on metal having work function . Photoelectric effect will take place on…
The work function for metals and are, respectively and 5.0 eV. According to Einstein equation, t…