Which of the following graphs between pressure ' p ' versus volume ' V ' represents the maximum work done?
Text Solution
Verified by ExpertsA
In a pressure-volume  graph, the magnitude of work done is represented by the area under the curve bounded by the volume axis.
Let's analyze the area under the curve for each graph:
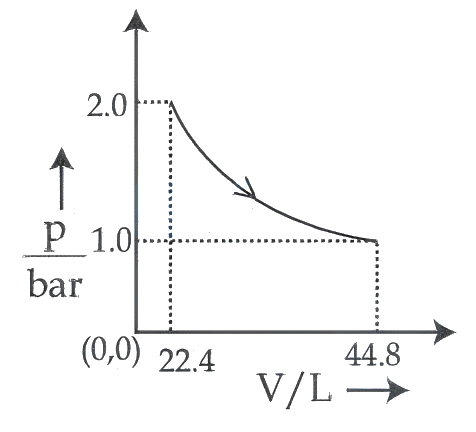
Graph represents an expansion from  to
to  . The area is the integral
  , which covers a significant region under the curve.
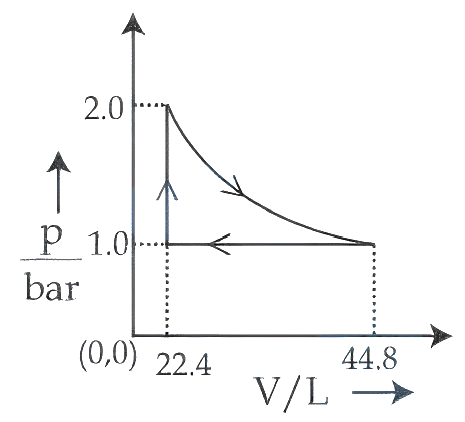
Graph represents a cyclic process. The net work done is the area enclosed by the loop. This area is much smaller than the total area under the expansion curve in graph .
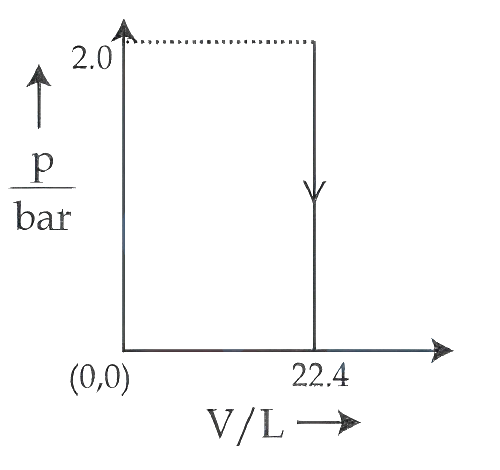
Graph represents an isochoric process (constant volume  ). Since
  , the work done
  .
.
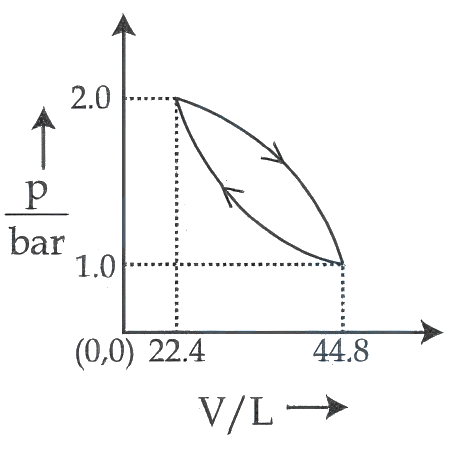
Graph also represents a cyclic process. Similar to graph , the net work done is the area enclosed by the loop, which is smaller than the area under the expansion curve in graph .
Comparing all cases, the expansion process in graph covers the maximum area under the  curve, thus representing the maximum work done.
Prepare Smarter with CGP Edu
Get practice questions, solutions, and test series in one place.
Write a Review
Share your experience with this question and solution.
Commentary
Send your comment, doubt, correction, or feedback to admin.
Similar Questions
Explore conceptually related problems