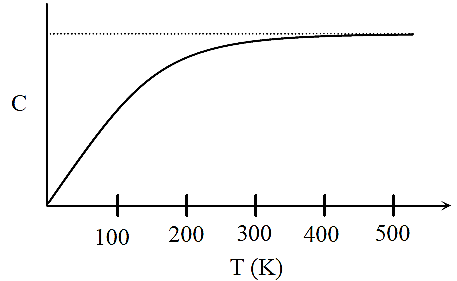
The figure shows the variation of specific heat capacity
Text Solution
Verified by ExpertsCHECK THE SOLUTION.
(A, B, C, D)
Option is correct because the graph between (0 – 100 K) appears to be a straight line upto a reasonable approximation.
Option is correct because area under the curve in the temperature range (0 - 100 K) is less than in range (400 - 500 K.)
Option is correct because the graph of C versus T is constant in the temperature range (400 - 500 K)
Option is correct because in the temperature range (200 – 300 K) specific heat capacity increases with temperature.
──────────────────────────────────────────────────────────────────────────────────────────
Prepare Smarter with CGP Edu
Get practice questions, solutions, and test series in one place.
Write a Review
Share your experience with this question and solution.
Commentary
Send your comment, doubt, correction, or feedback to admin.
Similar Questions
Explore conceptually related problems