SECTION-4 : (Maximum Marks : 12)
• This section contains TWO (02) paragraphs.
• Based on each paragraph, there are TWO (02) questions.
• The answer to each question is a NUMERICAL VALUE.
• For each question, enter the correct numerical value of the answer using the mouse and the onscreen virtual numeric keypad in the place designated to enter the answer.
• If the numerical value has more than two decimal places, truncate/round-off the value to TWO decimal places.
• Answer to each question will be evaluated according to the following marking scheme:
Full Marks : +3 If ONLY the correct numerical value is entered in the designated place;
Zero Marks : 0 In all other cases.
"PARAGRAPH I"
The entropy versus temperature plot for phases a and p at 1 bar pressure is given. st and So are entropies of the phases at temperatures T and 0 K, respectively.
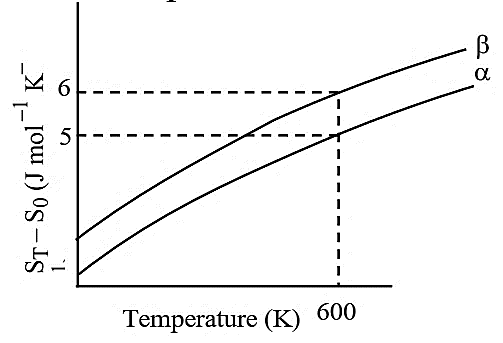
The transition temperature for  to
to  phase change is 600 K and
  = 1 J mol -1 K -1 . Assume
  is independent of temperature in the range of 200 to 700 K.
  and
and  are heat capacities of
  and
and  phases, respectively.
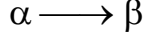
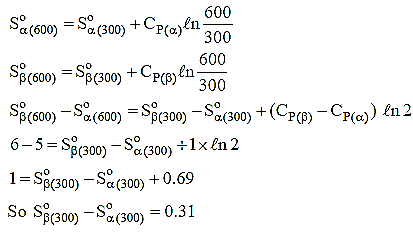
The value of entropy change,  (in J mol -1 K -1 ), at 300 K is__.
[Use : In 2 = 0.69 Given :  = 0 at 0 K]
Text Solution
Verified by Experts0.31
(0.31)
At 1 bar
──────────────────────────────────────────────────────────────────────────────────────────
Prepare Smarter with CGP Edu
Get practice questions, solutions, and test series in one place.
Write a Review
Share your experience with this question and solution.
Commentary
Send your comment, doubt, correction, or feedback to admin.
Similar Questions
Explore conceptually related problems