Published by:
CGP EDU Academic Team
Published on: August 12, 2026
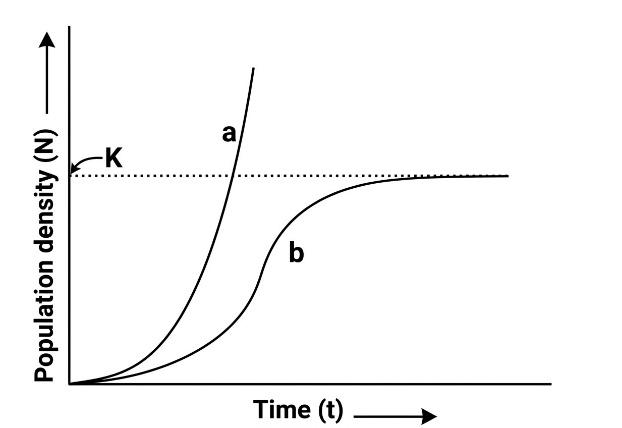
Graph ‘b’ is represented by the formula:
A

B

C

D

Text Solution
Verified by ExpertsThe correct answer is:
C
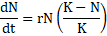
Curve 'b' shows an S-shaped (sigmoid) growth, which represents logistic growth where population growth slows as it approaches carrying capacity (K).
The logistic growth equation is:
──────────────────────────────────────────────────────────────────────────────────────────
Prepare Smarter with CGP Edu
Get practice questions, solutions, and test series in one place.
Write a Review
Share your experience with this question and solution.
Commentary
Send your comment, doubt, correction, or feedback to admin.
Similar Questions
Explore conceptually related problems