Published by:
CGP EDU Academic Team
Published on: August 14, 2026
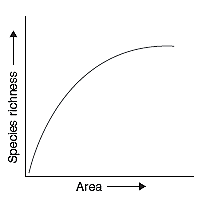
Which is the correct formula of the graph shown below? Given:
S-species richness
A-Area
C-Y-intercept
Z-Slope of line (regression coefficient)
Text Solution
Verified by ExpertsThe correct answer is:
A
This graph is the classic species-area relationship curve in ecology. The correct formula is:

•  species richness
•  area
area
•  -intercept (constant)
•  slope of the line (regression coefficient, typically between
  for most taxa)
──────────────────────────────────────────────────────────────────────────────────────────
Prepare Smarter with CGP Edu
Get practice questions, solutions, and test series in one place.
Write a Review
Share your experience with this question and solution.
Commentary
Send your comment, doubt, correction, or feedback to admin.
Similar Questions
Explore conceptually related problems
What does A, B, C, D, E and F represent in this figure?
p-chart for number of species of major tax…
Identify A, B, C and D in this figure.
p-chart for the number of species of major taxa of Inverteb…
Given below are pie diagrams I, II and III related to the proportionate number of species of major …
The great German naturalist and geographer Alexander von Humboldt observed that within a region spe…
What is A, B, C and D in this figure?
p-chart for number of species of major taxa of vertebrates
Given below are pie diagrams A, B and C related to proportionate number of species of major taxa of…