Given below is the diagram of the ecological pyramids.
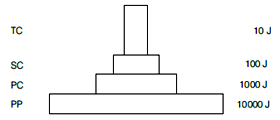
This type represents
Text Solution
Verified by ExpertsD
The diagram shows energy values decreasing step by step across trophic levels:
Primary producers (PP) → 10,000 J
Primary consumers (PC) → 1,000 J
Secondary consumers (SC) → 100 J
Tertiary consumers (TC) → 10 J
This clear decline illustrates the pyramid of energy, which is always upright because energy flow diminishes at each successive trophic level due to loss as heat and respiration.
──────────────────────────────────────────────────────────────────────────────────────────
Prepare Smarter with CGP Edu
Get practice questions, solutions, and test series in one place.
Write a Review
Share your experience with this question and solution.
Commentary
Send your comment, doubt, correction, or feedback to admin.
Similar Questions
Explore conceptually related problems