Published by:
CGP EDU Academic Team
Published on: August 12, 2026
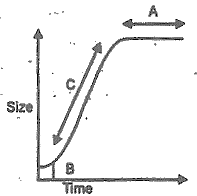
Given above is a graph drawn on the parameters of growth versus time. A, B, C respectively represent
Text Solution
Verified by ExpertsThe correct answer is:
NOT AVAILABLE
──────────────────────────────────────────────────────────────────────────────────────────
Prepare Smarter with CGP Edu
Get practice questions, solutions, and test series in one place.
Write a Review
Share your experience with this question and solution.
Commentary
Send your comment, doubt, correction, or feedback to admin.
Similar Questions
Explore conceptually related problems
Identify A, B, C and D in the given figure and choose the correct option.
In the given diagram, identify the type of growth phases of a zygote represented as A and B.
Among the following graphs, which shows the arithmetic growth curve?
Which of the following graphs show(s) the sigmoid growth curve?
In the given figure, find out the absolute and relative growth rate and choose the correct option.
…
Diagrams A and B indicate the shape of leaves in larkspur and buttercup, respectively. Choose the c…