Published by:
CGP EDU Academic Team
Published on: August 13, 2026
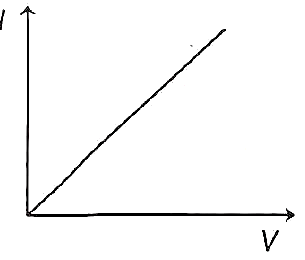
The graph between applied potential difference  and electric current
  for a metallic wire having length
  and area of cross-section
  is given in figure. The slope of the curve becomes
Text Solution
Verified by ExpertsThe correct answer is:
NOT AVAILABLE
From the given  graph of metallic wire,
  slope of graph
  Conductance
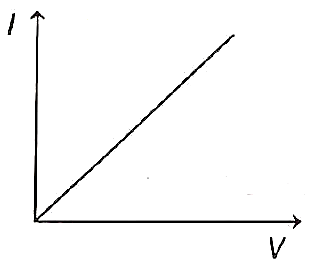

Hence, on increasing the length of the wire, its resistance increases, thus slope of the curve decreases.
──────────────────────────────────────────────────────────────────────────────────────────
Prepare Smarter with CGP Edu
Get practice questions, solutions, and test series in one place.
Write a Review
Share your experience with this question and solution.
Commentary
Send your comment, doubt, correction, or feedback to admin.
Similar Questions
Explore conceptually related problems
Physics
Three lenses of focal length and are available for making an astronomical telescope. To p…
In the third orbit of hydrogen atom, de-Broglie wavelength of an electron is , then radius of thir…
Work done by 3 mole of gas at to triple its volume at constant pressure is ( )
A transformer of efficiency has 200 turns in the primary winding and 40000 turns in secondary wind…
A particle is executing SHM of amplitude . At what displacement from the mean position, the energy…
Three particles each of mass are placed at the corners of an equilateral triangle of side . If th…