Which of the following graphs depicts the effect of substrate concentration on velocity of enzyme catalysed reaction?
Text Solution
Verified by ExpertsNOT AVAILABLE
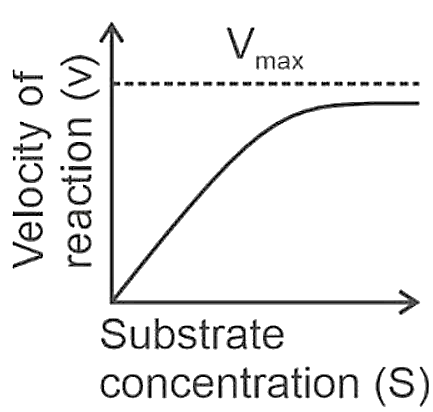
Option is the correct answer because with the increase in substrate concentration, the velocity of enzymatic reaction rises at first. The reaction ultimately reaches maximum velocity (  ) which is not exceeded by any further rise in concentration of the substrate. This is because the enzyme molecules are fewer than substrate molecules and after saturation of these molecules, there are no free enzyme molecules to bind the additional substrate molecules
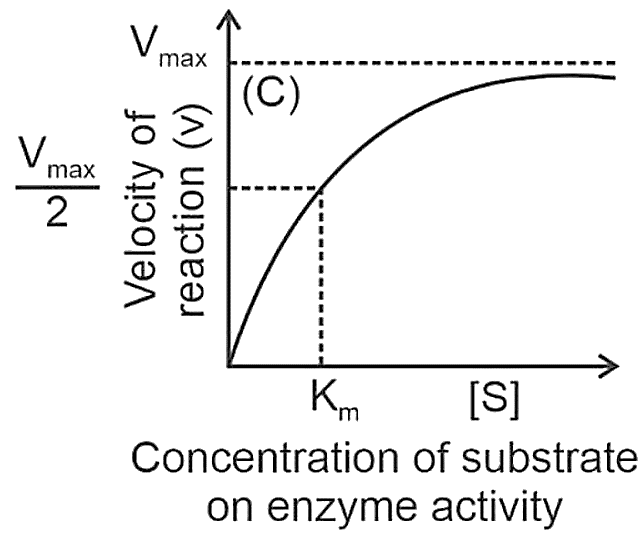
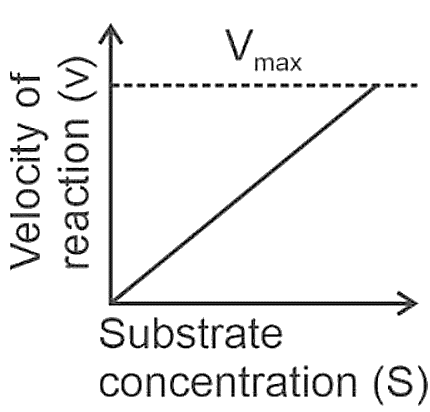
Option is incorrect as velocity of reaction is continuously increasing in the given graph.
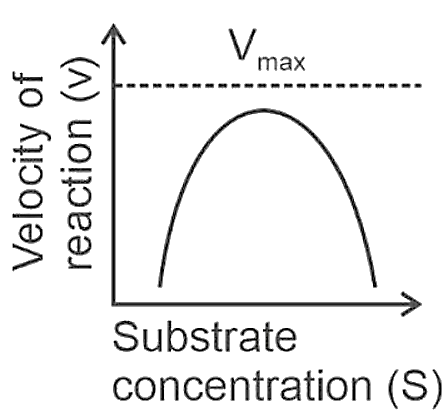
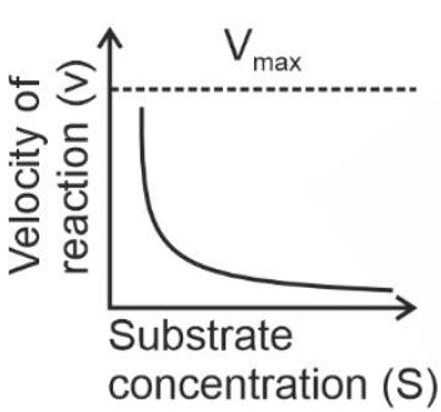
In option after reaching at  , velocity declines while in option velocity of reaction declines from high on increasing substrate concentration. So, option and are incorrect.
──────────────────────────────────────────────────────────────────────────────────────────
Prepare Smarter with CGP Edu
Get practice questions, solutions, and test series in one place.
Write a Review
Share your experience with this question and solution.
Commentary
Send your comment, doubt, correction, or feedback to admin.
Similar Questions
Explore conceptually related problems