Published by:
CGP EDU Academic Team
Published on: August 13, 2026
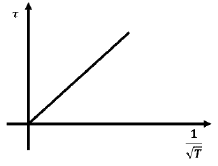
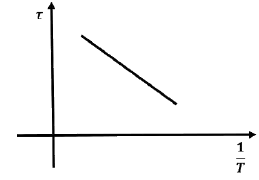
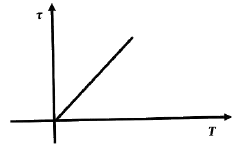
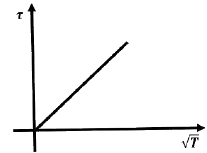
Which graph correctly represents the variation between relaxation time  of gas molecules with absolute temperature
  of the gas?
A
B
C
D
Text Solution
Verified by ExpertsThe correct answer is:
A

──────────────────────────────────────────────────────────────────────────────────────────
Prepare Smarter with CGP Edu
Get practice questions, solutions, and test series in one place.
Write a Review
Share your experience with this question and solution.
Commentary
Send your comment, doubt, correction, or feedback to admin.
Similar Questions
Explore conceptually related problems
PART-I PHYSICS
A block of mass is connected at one end of natural length and spring constant . T…
Three charges are placed on the circumference of a circle of radius as shown in the figure. The el…
Choose the correct graph of an ideal gas for the given graph.
Find the co-ordinates of center of mass of the lamina shown in the figure below.
If two capacitors and are connected in a parallel combination then the equivalent capacitance is …
A rod of mass and length is hinged at its midpoint. A ball of mass is moving in the plane of the…