Published by:
CGP EDU Academic Team
Published on: August 13, 2026
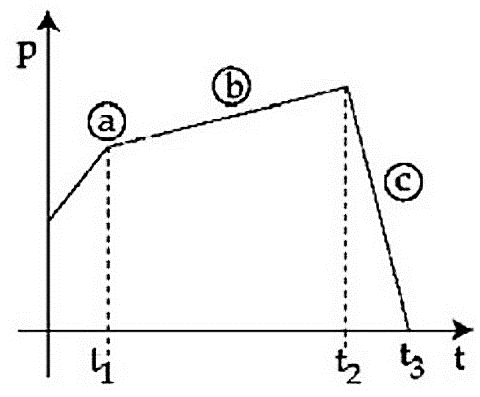
The figure represents the momentum time  curve for a particle moving along an axis under the influence of the force. Identify the regions on the graph where the magnitude of the force is maximum and minimum respectively?
If 
A
c and b
B
b and c
C
 and
and 
D
c and a
Text Solution
Verified by ExpertsThe correct answer is:
A
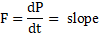
Slope of curve P-t will represent the force so
Maximum slope 
Minimum slope 
──────────────────────────────────────────────────────────────────────────────────────────
Prepare Smarter with CGP Edu
Get practice questions, solutions, and test series in one place.
Write a Review
Share your experience with this question and solution.
Commentary
Send your comment, doubt, correction, or feedback to admin.
Similar Questions
Explore conceptually related problems
PART-I PHYSICS
SECTION-A
The magnetic moments associated with two closely wound circular coils and…
The figure represents the momentum time curve for a particle moving along an axis under the influe…
Two isolated metallic solid spheres of radii and are charged such that both have same charge dens…
A person has been using spectacles of power -1.0 dioptre for distant vision and a separate reading …
A small object at rest, absorbs a light pulse of power and duration . Assuming speed of light as …
Match Column-I with Column-II :
Choose the correct answer from the options given below: