A person's wound was exposed to some bacteria and then bacteria growth started to
happen at the same place. The wound was later treated with some antibacterial medicine and the rate of bacterial decay (r) was found to be proportional with the square of the existing number of bacteria at any instance. Which of the following set of graphs correctly represents the 'before' and 'after' situation of the application of the medicine?
[Given :  No. of bacteria,
  time, bacterial growth follows
  order kinetics.]
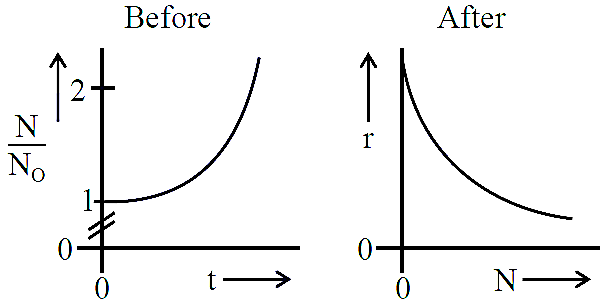
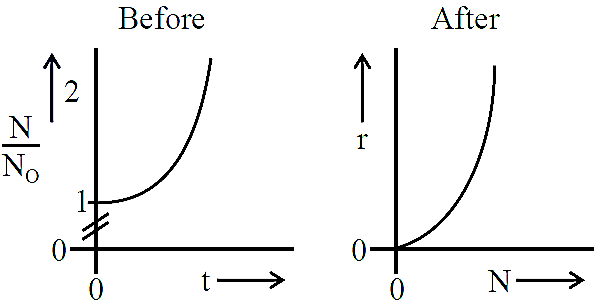
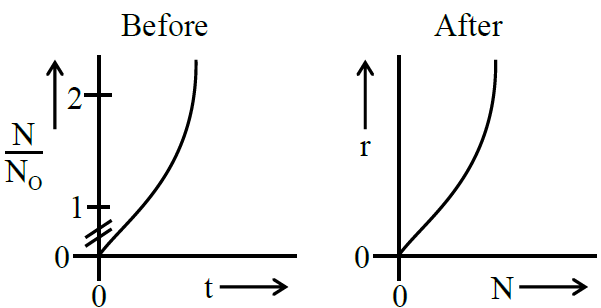
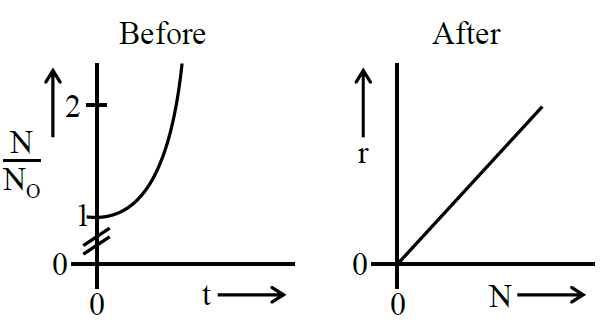
Text Solution
Verified by ExpertsB
*Before applying medicine
 (First order growth) (Rate law)

*After applying medicine
Active Bacteria  Inactive Bacteria
(I)
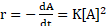 (Rate law)
 Parabola
──────────────────────────────────────────────────────────────────────────────────────────
Prepare Smarter with CGP Edu
Get practice questions, solutions, and test series in one place.
Write a Review
Share your experience with this question and solution.
Commentary
Send your comment, doubt, correction, or feedback to admin.
Similar Questions
Explore conceptually related problems