Published by:
CGP EDU Academic Team
Published on: August 12, 2026
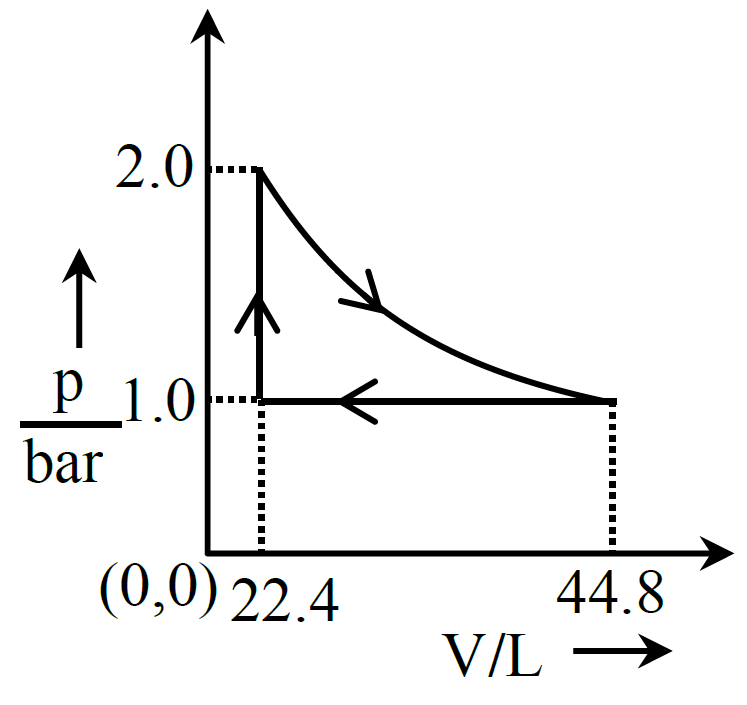
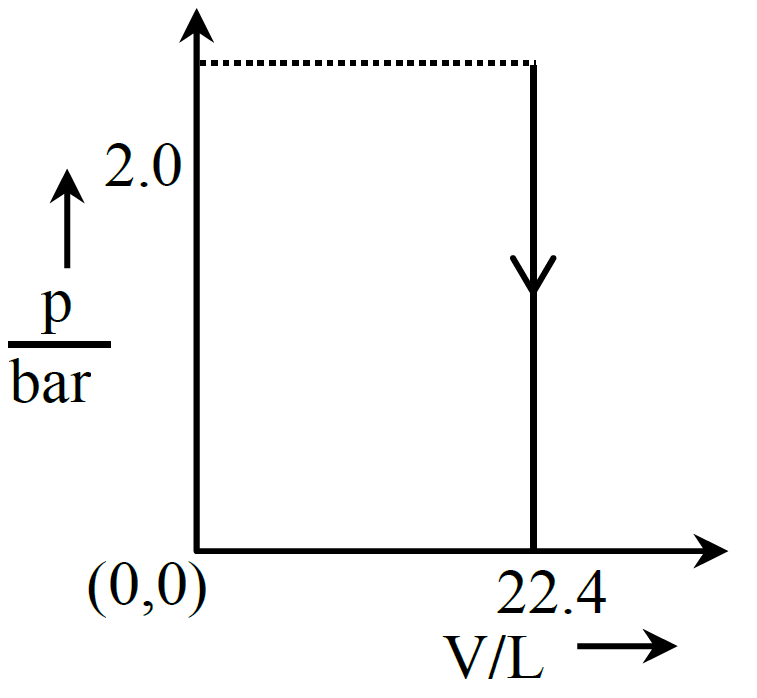
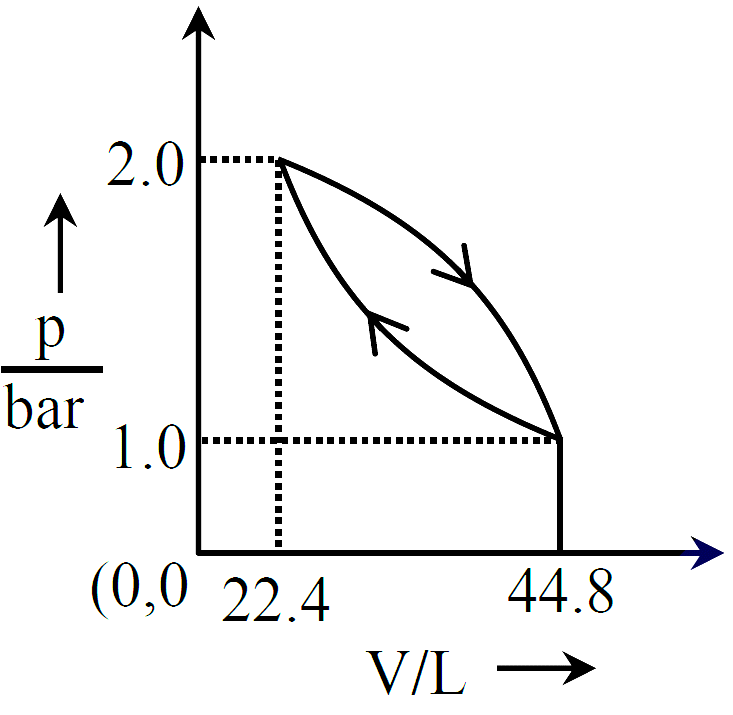
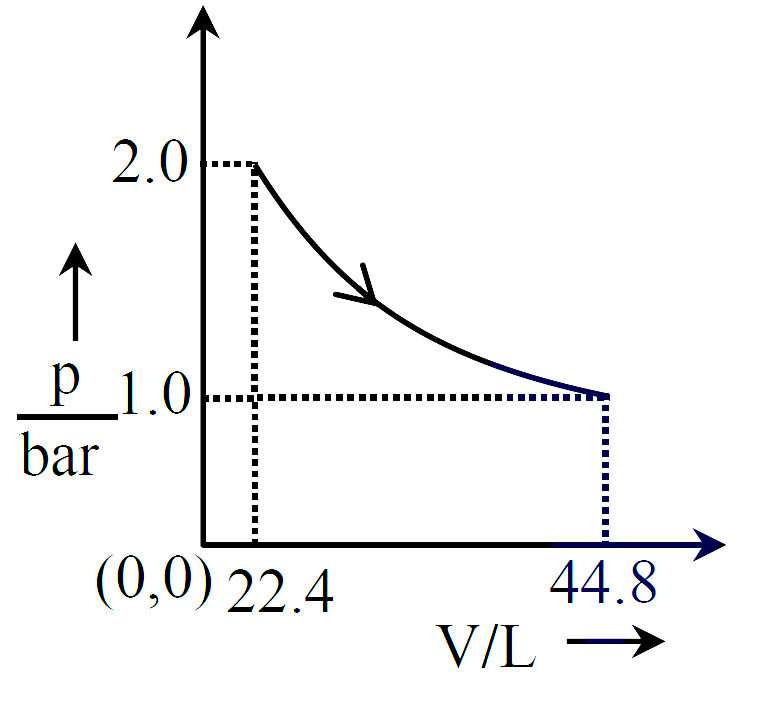
Which of the following graphs between pressure 'P' versus volume 'V' represent the maximum work done?
A
B
C
D
Text Solution
Verified by ExpertsThe correct answer is:
D
Area under the  curve, is equal to magnitude of work. In option work done is zero while in remaining options net work done is negative due to expansion. NTA has given the answer without considering the negative sign that is considered only magnitude.
──────────────────────────────────────────────────────────────────────────────────────────
Prepare Smarter with CGP Edu
Get practice questions, solutions, and test series in one place.
Write a Review
Share your experience with this question and solution.
Commentary
Send your comment, doubt, correction, or feedback to admin.
Similar Questions
Explore conceptually related problems
Potential energy ( ) versus distance ( ) is given by the graph, Rank various regions as per the m…
A gas based geyser heats water flowing at the rate of 5.0 litres per minute from to . The rate o…
A conducting circular loop of area is placed perpendicular to a magnetic field which varies as Te…
Water flows through a horizontal tube as shown in the figure. The difference in height between the …
In an experiment the values of two spring constants were measured as and . If these springs are c…
A 4 kg mass moves under the influence of a force where is the time in second. If mass starts from…