Published by:
CGP EDU Academic Team
Published on: August 21, 2026
What does A, B, C, D, E and F represent in this figure?
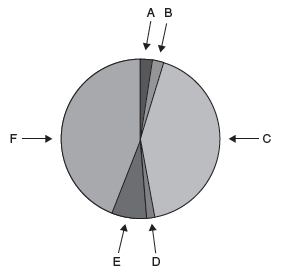
p-chart for number of species of major taxa of plants.
Text Solution
Verified by ExpertsThe correct answer is:
D
( A): Mosses (small slice at the top)
: Ferns and allies (small slice next to mosses)
: Angiosperms (largest slice on the right)
: Lichens (small slice at the bottom)
(E): Algae (small slice near bottom)
(F): Fungi (large slice on the left)
Prepare Smarter with CGP Edu
Get practice questions, solutions, and test series in one place.
Write a Review
Share your experience with this question and solution.
Commentary
Send your comment, doubt, correction, or feedback to admin.
Similar Questions
Explore conceptually related problems
Which is the correct formula of the graph shown below? Given:
S-species richness
A-Area
C-Y-interce…
Identify A, B, C and D in this figure.
p-chart for the number of species of major taxa of Inverteb…
Given below are pie diagrams I, II and III related to the proportionate number of species of major …
The great German naturalist and geographer Alexander von Humboldt observed that within a region spe…
Given below are pie diagrams A, B and C related to proportionate number of species of major taxa of…
Using the figure, determine the percentage of bird species that will be lost if the island's inhabi…