Published by:
CGP EDU Academic Team
Published on: August 20, 2026
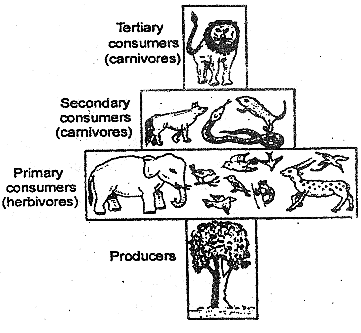
The given figure best represents –
Text Solution
Verified by ExpertsThe correct answer is:
D
The figure shows:
- One producer (a tree) at the base.
- Many primary consumers (herbivores like insects, deer, elephant, etc.).
- Fewer secondary consumers.
- Very few tertiary consumers at the top.
Prepare Smarter with CGP Edu
Get practice questions, solutions, and test series in one place.
Write a Review
Share your experience with this question and solution.
Commentary
Send your comment, doubt, correction, or feedback to admin.
Similar Questions
Explore conceptually related problems
How much energy of sunlight is converted by primary producers into NPP in the above energy pyramid?
How many top-carnivores are supported in an above grassland ecosystem based on production of nearly…
A chart is given to represent the phosphorus cycle in a terrestrial ecosystem. Find out what
The stage of succession represented in the diagram is
Select the correct match for the below given stages of succession.
How many food chains are there in the food web shown below?