Published by:
CGP EDU Academic Team
Published on: August 21, 2026
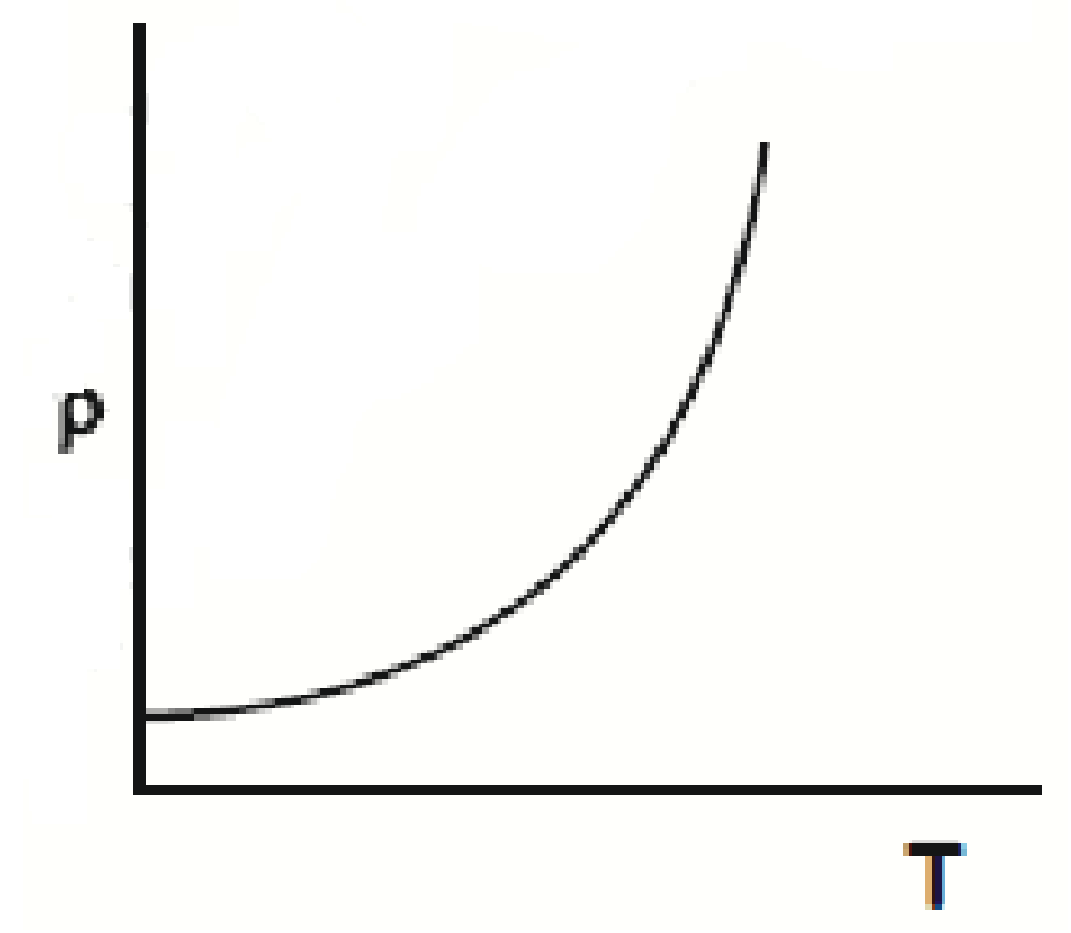
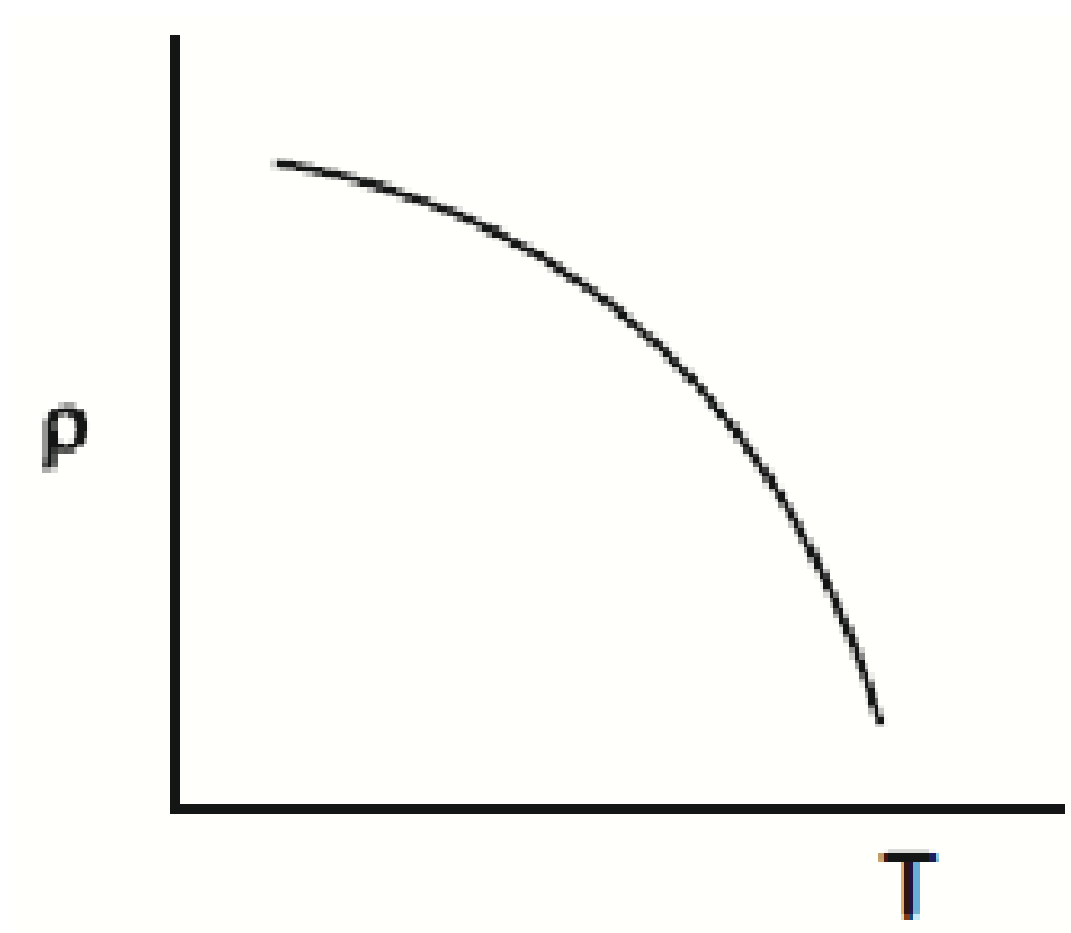
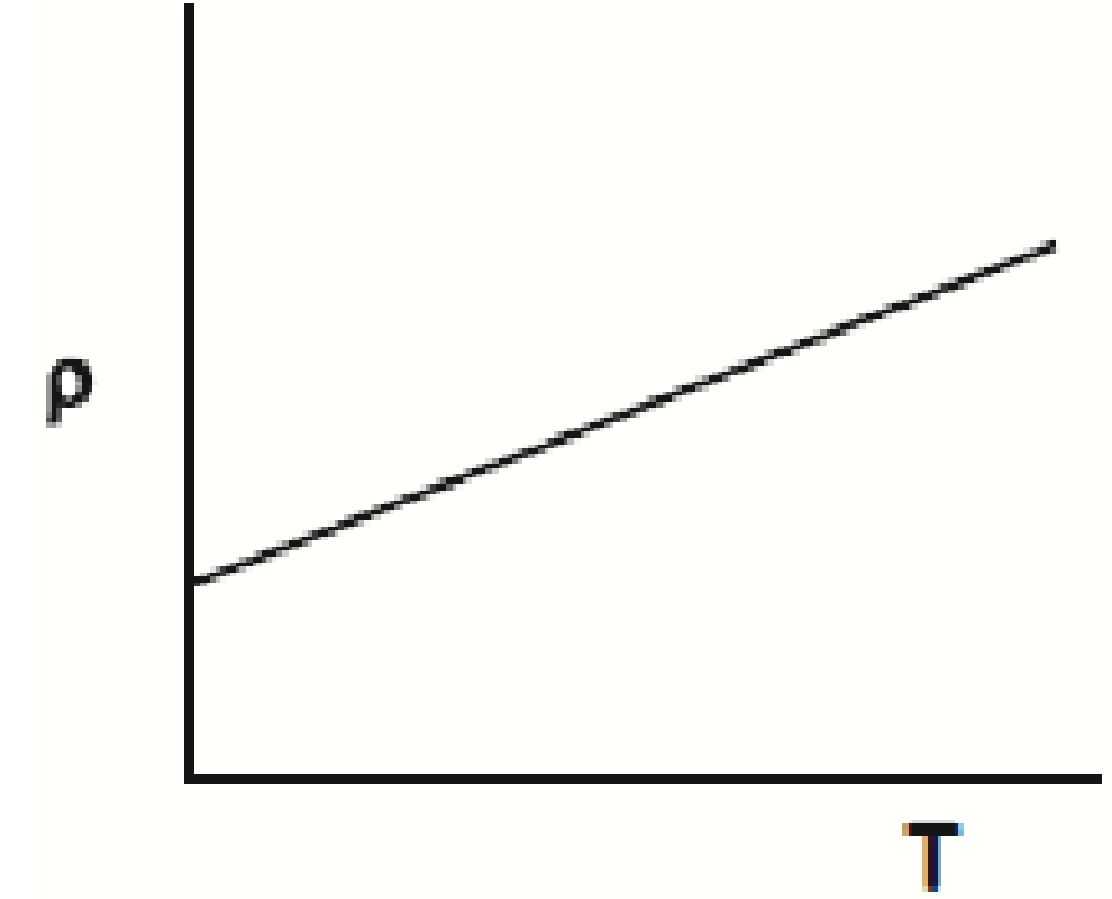
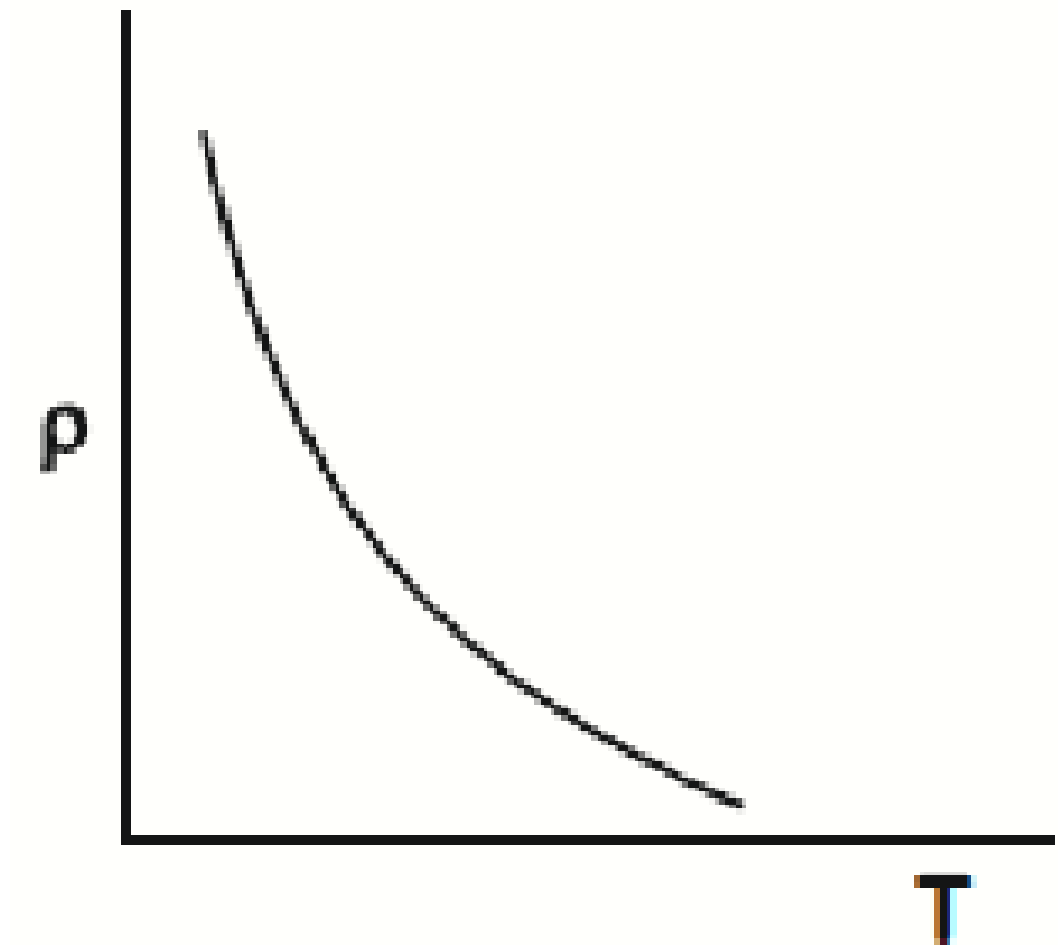
Which of the following graph represents the variation of resistivity (p) with temperature (T) for copper?
A
B
C
D
Text Solution
Verified by ExpertsThe correct answer is:
We know that at temperatures much lower than G°C, the graph deviates significantly from a straight line.
Hence is the correct among all,
Prepare Smarter with CGP Edu
Get practice questions, solutions, and test series in one place.
Write a Review
Share your experience with this question and solution.
Commentary
Send your comment, doubt, correction, or feedback to admin.
Similar Questions
Explore conceptually related problems
Which of the following will NOT be observed when a multimeter (operating in resistance measuring mo…
A galvanometer of resistance G is converted into a voltmeter of range by connecting a resistance …
A galvanometer is used in laboratory for detecting the null point in electrical experiments. If, on…
In a building there are bulbs of , bulbs of , small fans of and heaters of . The voltage of…
The length of a potentiometer wire is and it carries a current of . For a cell of emf and intern…
A galvanometer having a coil resistance gives a full-scale deflection when a current of is passed…