Published by:
CGP EDU Academic Team
Published on: August 21, 2026
In a given population of 2000 individuals, 160 birth and 250 deaths were reported over a given period of time. Which of the following graphs will correspond to it?
A
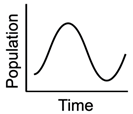
B
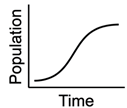
C
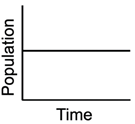
D
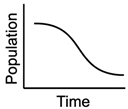
Text Solution
Verified by ExpertsThe correct answer is:
D
Number of deaths is more than the number of births, showing a declining population.
Prepare Smarter with CGP Edu
Get practice questions, solutions, and test series in one place.
Write a Review
Share your experience with this question and solution.
Commentary
Send your comment, doubt, correction, or feedback to admin.
Similar Questions
Explore conceptually related problems
The given diagram is related to which stage of succession?
Biome distribution is shown with respect to annual temperature and precipitation. Correctly identif…
Various age pyramids (P-R) for human population are shown below. Select the option with correct ide…
Label the A & B.
(A)(B)(a)Conformers(i)Regulators(b)Regulators(ii)Partial regulators(c)Conformers(…
Which of the following option is correct regarding the curves in the given graph?
In the given figure, identify the desert and coniferous forest respectively from the markings (A-F)…