Published by:
CGP EDU Academic Team
Published on: August 21, 2026
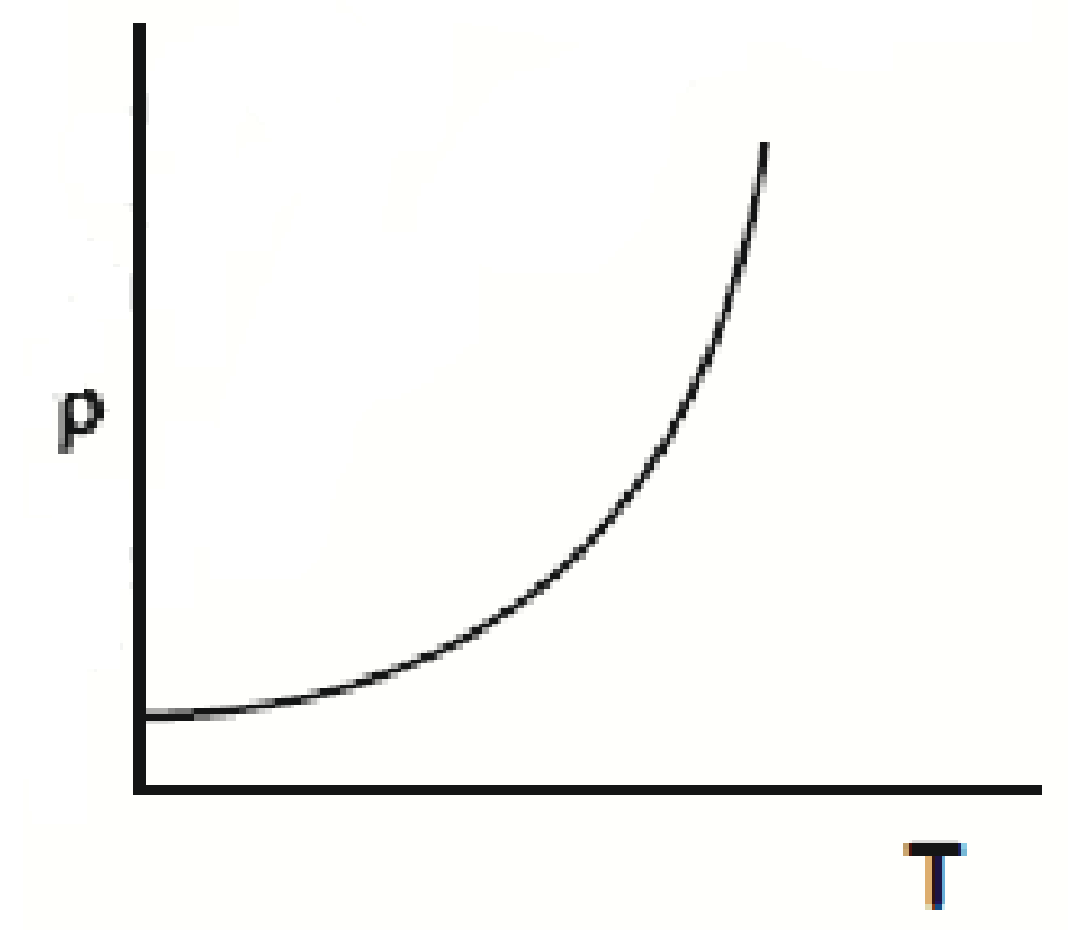
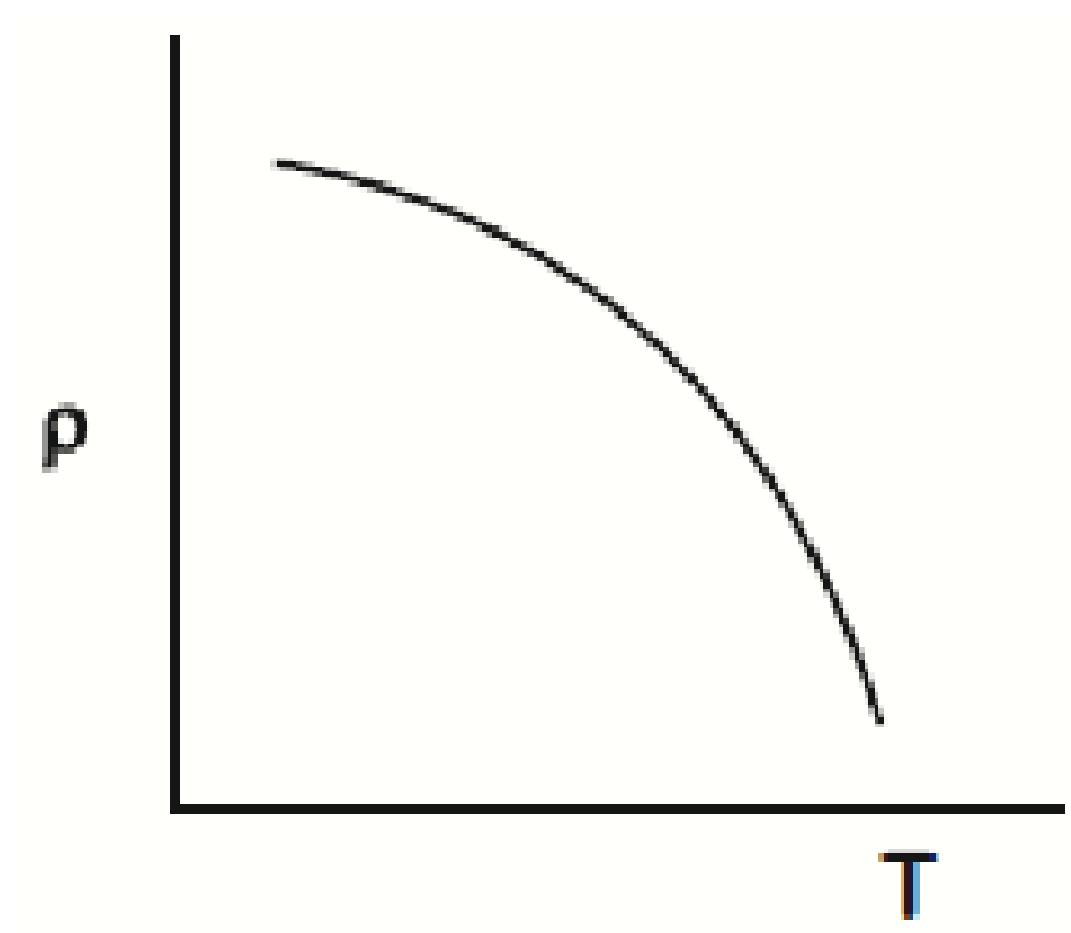
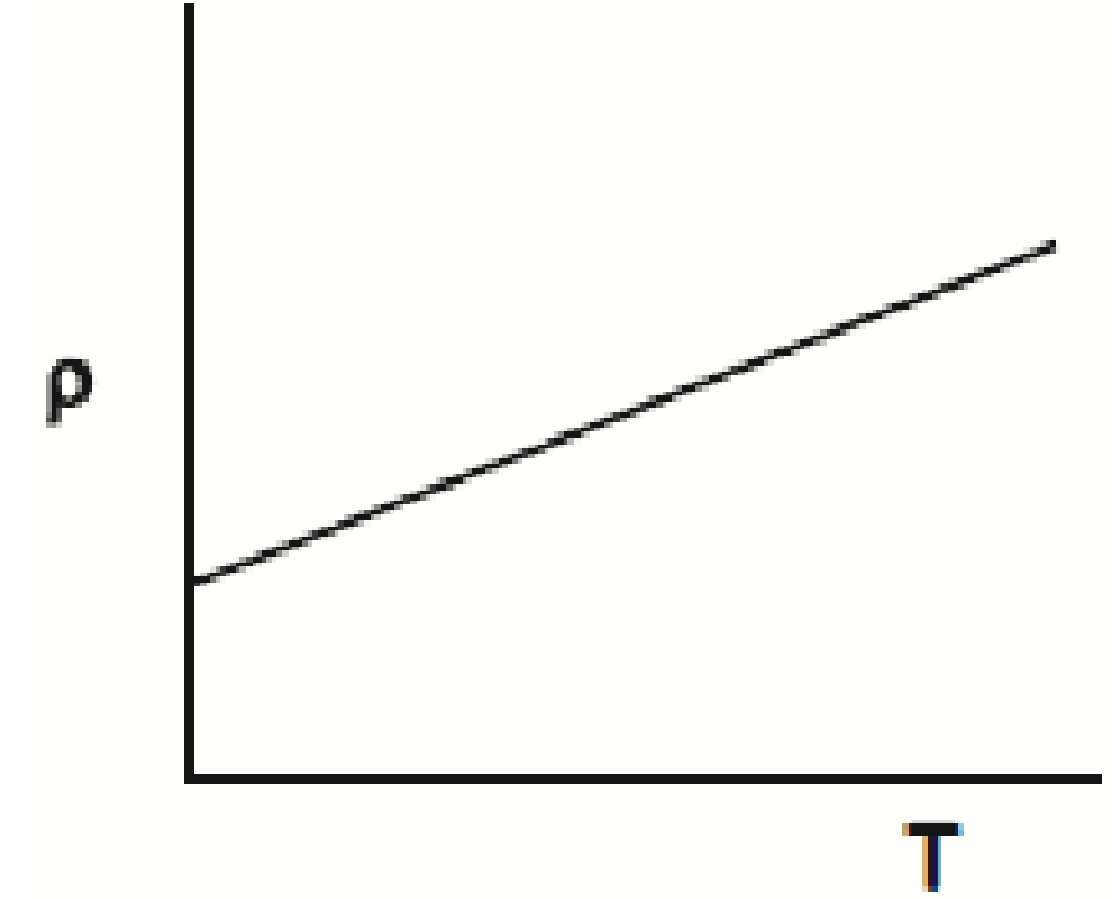
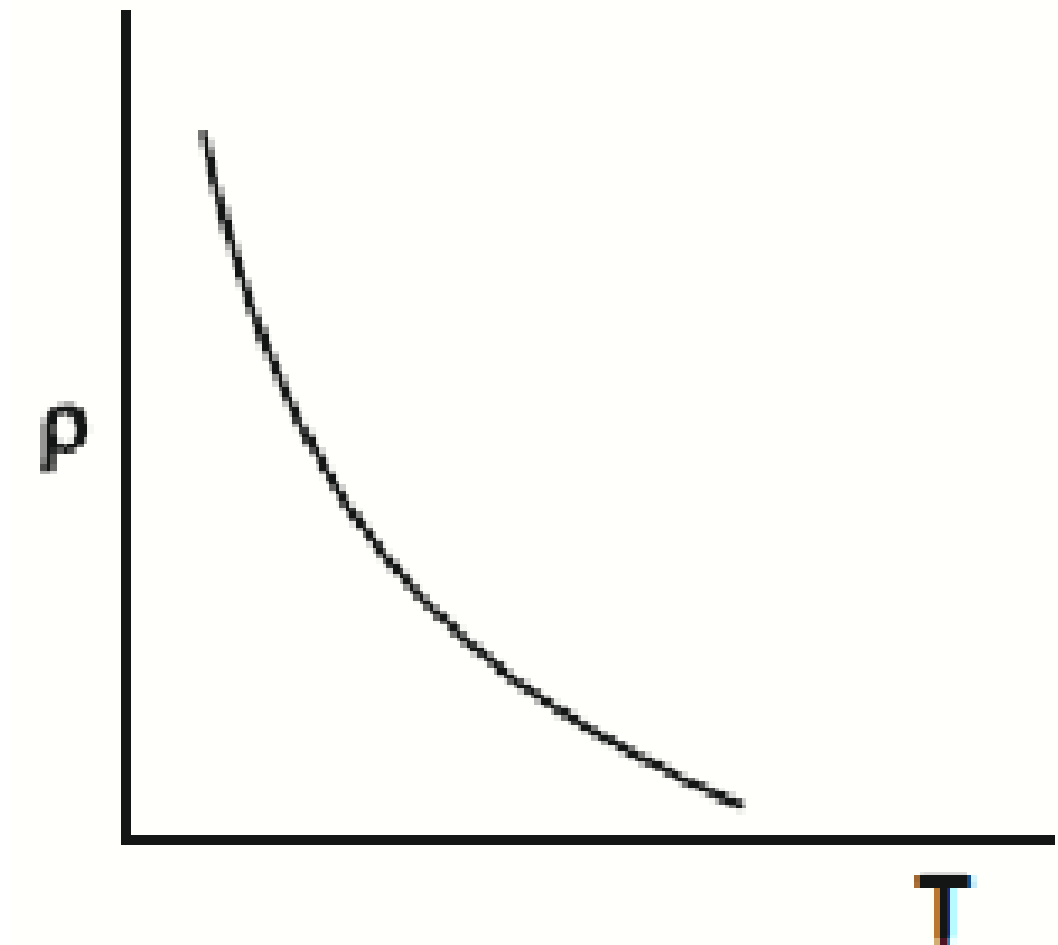
Which of the following graph represents the variation of resistivity (p) with temperature (T) for copper?
A
B
C
D
Text Solution
Verified by ExpertsThe correct answer is:
We know that at temperatures much lower than G°C, the graph deviates significantly from a straight line.
Hence is the correct among all,
Prepare Smarter with CGP Edu
Get practice questions, solutions, and test series in one place.
Write a Review
Share your experience with this question and solution.
Commentary
Send your comment, doubt, correction, or feedback to admin.
Similar Questions
Explore conceptually related problems
A screw gauge has least count of 0.01 mm and there are 50 divisions in its circular scale.
The pitc…
Two bodies of mass 4 kg and 6 kg are tied to the ends of a massless string. The string passes over …
An electron is accelerated from rest through a potential difference of V volt If the de Broglie wav…
In a certain region of space with volume 0.2 m 3 , the electric potential is found to be 5 V throug…
A cylinder contains hydrogen gas at pressure of 249 kPa and temperature 27°C.
Its density is : (R =…
The mean free path for a gas, with molecular diameter d and number density n can be expressed as :