Published by:
CGP EDU Academic Team
Published on: August 23, 2026
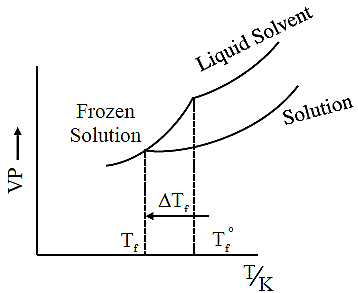
Consider the given plots of vapour pressure (VP) vs temperature (  ) Which amongst the following options is correct graphical representation showing
  , depression in the freezing point of solvent in a solution?
A
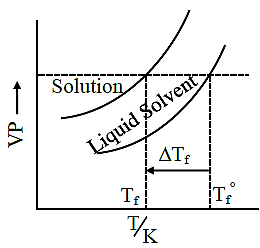
B
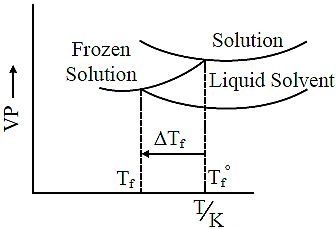
C
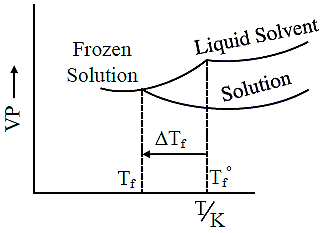
D
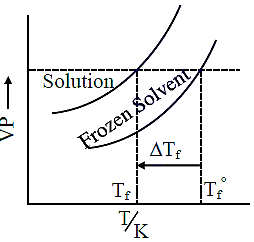
Text Solution
Verified by ExpertsThe correct answer is:
C
On adding non-volatile solute in a solvent, the freezing point of solution decreases.

F.P. of solution  F.P. of pure solvent
Also V.P. of solution decreases on adding nonvolatile solute in a solvent.
──────────────────────────────────────────────────────────────────────────────────────────
Prepare Smarter with CGP Edu
Get practice questions, solutions, and test series in one place.
Write a Review
Share your experience with this question and solution.
Commentary
Send your comment, doubt, correction, or feedback to admin.
Similar Questions
Explore conceptually related problems
Section - A
Consider a parallel plate capacitor of area A (of each plate) and separation 'd' betwee…
What is the relative decrease in focal length of a lens for an increase in optical power by 0.1 D f…
An air bubble of radius 0.1 cm lies at a depth of 20 cm below the free surface of a liquid of densi…
For an experimental expression , where all the digits are significant. Then to report the value of…
During the transition of electron from state A to state C of a Bohr atom, the wavelength of emitted…
Consider the following statements :