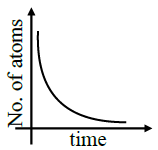
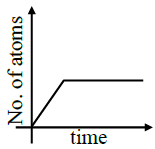
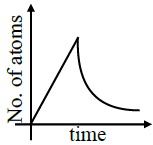
A sample of a radioactive nucleus A disintegrates to another radioactive nucleus  , which in turn disintegrates to some other stable nucleus C. Plot of a graph showing the variation of number of atoms of nucleus
  vesus time is :
(Assume that at  , there are no
  atoms in the sample)
Text Solution
Verified by ExpertsB
 (stable)
Initially no. of atoms of  after
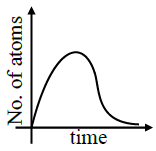
after  , no. of atoms of
  will starts increasing & reaches maximum value when rate of decay of
  rate of formation of B. After that maximum value, no. of atoms will starts decreasing as growth
  decay both are exponential functions, so best possible graph is
──────────────────────────────────────────────────────────────────────────────────────────
Prepare Smarter with CGP Edu
Get practice questions, solutions, and test series in one place.
Write a Review
Share your experience with this question and solution.
Commentary
Send your comment, doubt, correction, or feedback to admin.
Similar Questions
Explore conceptually related problems