Which of the following graph represents the variation of resistivity (ρ) with temperature (T) for copper? [NEET 2020]
A

B

C

D

Text Solution
Verified by ExpertsThe correct answer is:
B
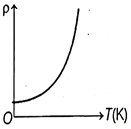
Resistivity of copper (a metal) as a function of temperature increases with the increase in temperature as shown below
Prepare Smarter with CGP Edu
Get practice questions, solutions, and test series in one place.
Write a Review
Share your experience with this question and solution.
Commentary
Send your comment, doubt, correction, or feedback to admin.
Similar Questions
Explore conceptually related problems
A galvanometer having a coil resistance of 60 Ω Ω shows full scale deflection when a current of 1.0…
A student measures the terminal potential difference (V) of a cell (of emf ε and internal resistanc…
See the electrical circuit shown in this figure. Which of the following equations is a correct equa…
A thermocouple of negligible resistance produces an e.m.f. of 40 µV/°C in the linear range of tempe…
In the circuit shown in the figure, if potential at point A is taken to be zero the potential at po…
A milli voltmeter of 25 milli volt range is to be converted into an ammeter of 25 ampere range. The…