Published by:
CGP EDU Academic Team
Published on: August 13, 2026
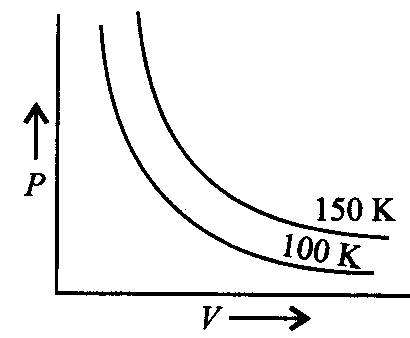
A graph is plotted between pressure and volume at different temperatures. On the basis of the graph what changes will you observe in the volume if
(i) The pressure is increased at constant temperature.
(ii) The temperature is decreased at constant pressure.
Text Solution
Verified by ExpertsThe correct answer is:
B
: Volume decreases when pressure is increased at constant temperature when temperature is decreased at constant pressure, the volume decreases.
Prepare Smarter with CGP Edu
Get practice questions, solutions, and test series in one place.
Write a Review
Share your experience with this question and solution.
Commentary
Send your comment, doubt, correction, or feedback to admin.
Similar Questions
Explore conceptually related problems
As the temperature is raised from to the average kinetic energy of neon atoms changes by a factor…
A gas is found to have a formula . If its vapour density is 70, the value of is
Which of the given sets of temperature and pressure will cause a gas to exhibit the greatest deviat…
The molecular weight of and are 32 and 64 respectively. If one litre of at and 750 mm pressure …
What is the relationship between the average velocity ( v ), root mean square velocity ( u ) and mo…
Consider the following statements : For diatomic gases, the ratio is equal to
(1) 1.40 (lower temp…