Published by:
CGP EDU Academic Team
Published on: August 13, 2026
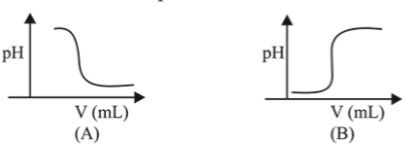
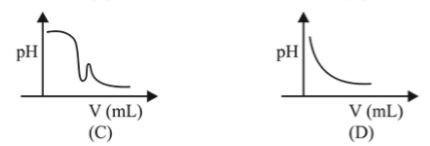
In an acid base titration,  solution was added to the
  solution of unknown strength. Which of the following correctly shows the change of
  of the titration mixture in this experiment?
A

B

C

D

Text Solution
Verified by ExpertsThe correct answer is:
B
Graph  and
and  , both represents the titration curve between strong acid and strong base, i.e.,
  and
and  but, the
  of
of  is more than
  and during the titration it decreases, so graph
  is correct.
Prepare Smarter with CGP Edu
Get practice questions, solutions, and test series in one place.
Write a Review
Share your experience with this question and solution.
Commentary
Send your comment, doubt, correction, or feedback to admin.
Similar Questions
Explore conceptually related problems
of solution is added to of solution. The of the resultant mixture is: of
For the equilibrium the value of is approximately:
If of is the molar solubility of in is:
If solubility product of is denoted by and its molar solubility is denoted by , then which of th…
The of a solution will be [given and
What is the molar solubility of in solution? Given that, solubility product of :