Published by:
CGP EDU Academic Team
Published on: August 12, 2026
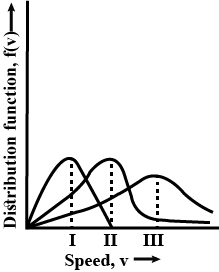
Points I, II and III in the following plot respectively correspond to (  : most probable velocity).
A
 of
of  (300 K);
  of
of  (400 K);
  of
of  (300 K)
B
 of
of  (400 K);
  of
of  (300 K);
  of
of  (300 K)
C
 of
of  (300 K);
  of
of  (300 K);
  of
of  (400 K)
D
 of
of  (300 K);
  of
of  (300 K);
  of
of  (400 K)
Text Solution
Verified by ExpertsThe correct answer is:
A
JEE Main 2019
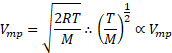
From curve,

 (under given condition)
Prepare Smarter with CGP Edu
Get practice questions, solutions, and test series in one place.
Write a Review
Share your experience with this question and solution.
Commentary
Send your comment, doubt, correction, or feedback to admin.
Similar Questions
Explore conceptually related problems
0.5 moles of gas A and moles of gas B exert a pressure of 200 Pa in aa container of volume at 100…
The volume of gas A is twice than that of gas B. The compressibility factor of gas A is thrice than…
The combination of plots which does not represent isothermal expansion of an ideal gas :
An open vessel at is heated is heated until three-fifth of the air in it has been expelled. Assumi…
Consider the van der Waals constant, a and b for the following gases,
Gas Ar Ne Kr Xe
a/(atm ) 1.3…
At a given temperature T, gases Ne, Ar, Xe and Kr are found to deviate from ideal gas behavior. The…