Published by:
CGP EDU Academic Team
Published on: August 13, 2026
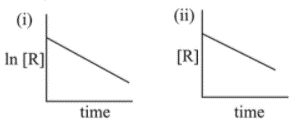
The given plots represents the variation of the concentration of a reactant R with time for two different reactions (i) and (ii). The representive orders of the reactions are :
Text Solution
Verified by ExpertsThe correct answer is:
A
In graph (i), In [Reactant vs time is linear with positive intercept and negative slope. Hence it is 1 st order In graph (ii), [Reactant] vs time near with positive intercept and negative slope. Hence, it is zero order.
Prepare Smarter with CGP Edu
Get practice questions, solutions, and test series in one place.
Write a Review
Share your experience with this question and solution.
Commentary
Send your comment, doubt, correction, or feedback to admin.
Similar Questions
Explore conceptually related problems
The following results were obtained during kinetic studies of the reaction;
Experiment [A](in mol …
For the reaction, products, when the concentrations of A and B both were doubled, the rate of the …
Consider the given plots for a reaction obeying Arrhenius equation and are rate constant and acti…
For an elementary chemical reaction, the expression for is :
If a reaction follows the Arrhenius equation, the plot Ink vs gives staright line with a gradient …
The reaction is a zeroth orer reaction. If the initial concentration of X is 0.2 M, the half-life …