When a sample of an ideal gas is changed from an initial state to a final state, various curves can be plotted for the process like P–V curve, V–T curve, P–T curve etc.
For example, P–V curve for a fixed amount of an ideal gas at constant temperature is a rectangular hyperbola, V–T curve for a fixed amount of an ideal gas at constant pressure is a straight line and P–T curve for a fixed amount of an ideal gas at constant volume is again a straight line. However, the shapes may vary if the constant parameters are also changed.
Now, answer the following questions :
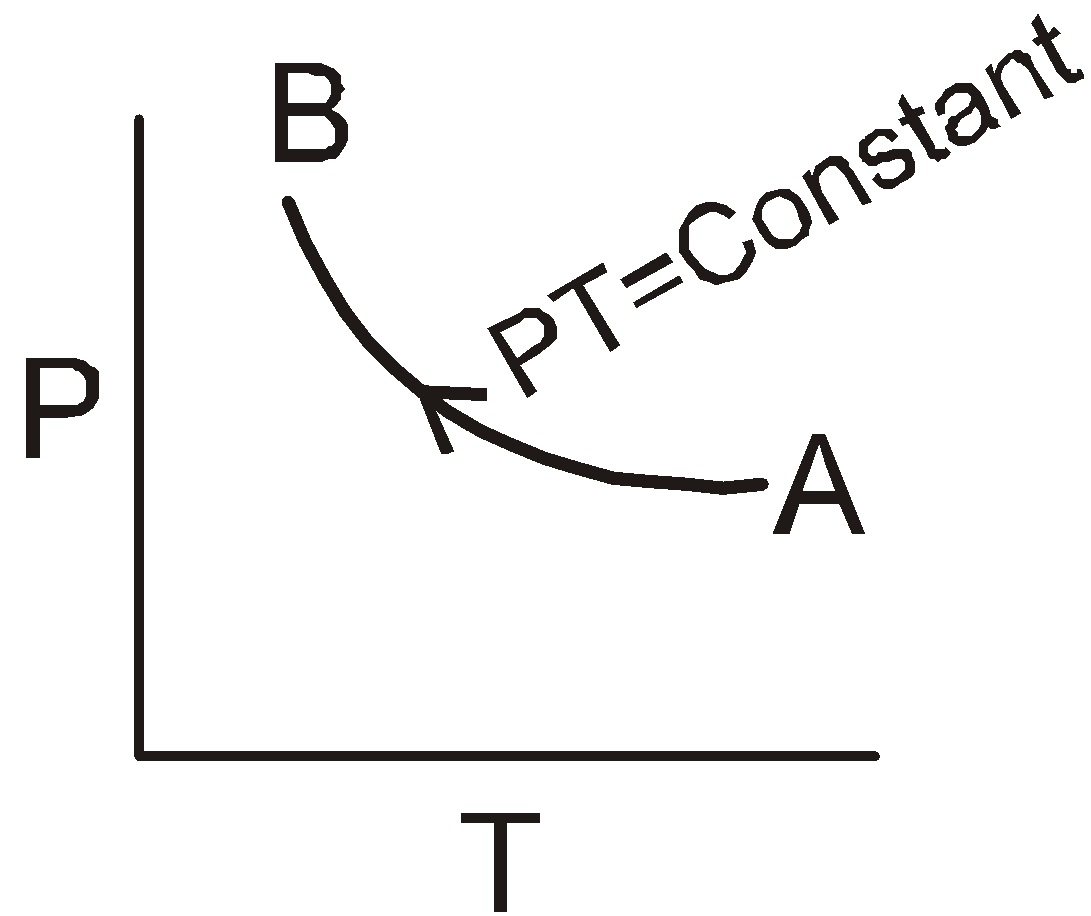
(i) Which of the following statements is correct regarding a fixed amount of ideal gas undergoing the following process :
Text Solution
Verified by ExpertsCHECK THE SOLUTION.
(i)b
Temperature decreases during process A to B, so RMS speed decreases (V RMS )
d gas =  . Upon moving from A to B, P increases and temperature decreases. So, density of gas increases.
This graph is possible if during the process : P ∝  .
.
PT = Constant ∴ P  = Constant ∴ P 2 V = Constant or PV 1/2 = Constant
If P B = 4P A , then V A = 16V B (according to P 2 V = Constant for process)
(ii)b Equation of straight line
(y – y 1 ) =  (x – x 1 )
(P – 16) =  (V – 6)
3P + 4V = 72
T max = 
For (PV) max , 3P =  and 4V =
P = 12, V = 9
T max =  = 648K.
(iii)d This graph is possible if temperature of gas is kept constant and pressure is increased from A to B.
This graph is possible if temperature of gas is increased continuously during the process A to B.
This graph is possible if during the process : P ∝ 
VT = constant ∴  = Constant or PV 2 = constant.
Prepare Smarter with CGP Edu
Get practice questions, solutions, and test series in one place.
Write a Review
Share your experience with this question and solution.
Commentary
Send your comment, doubt, correction, or feedback to admin.
Similar Questions
Explore conceptually related problems