Published by:
CGP EDU Academic Team
Published on: August 12, 2026
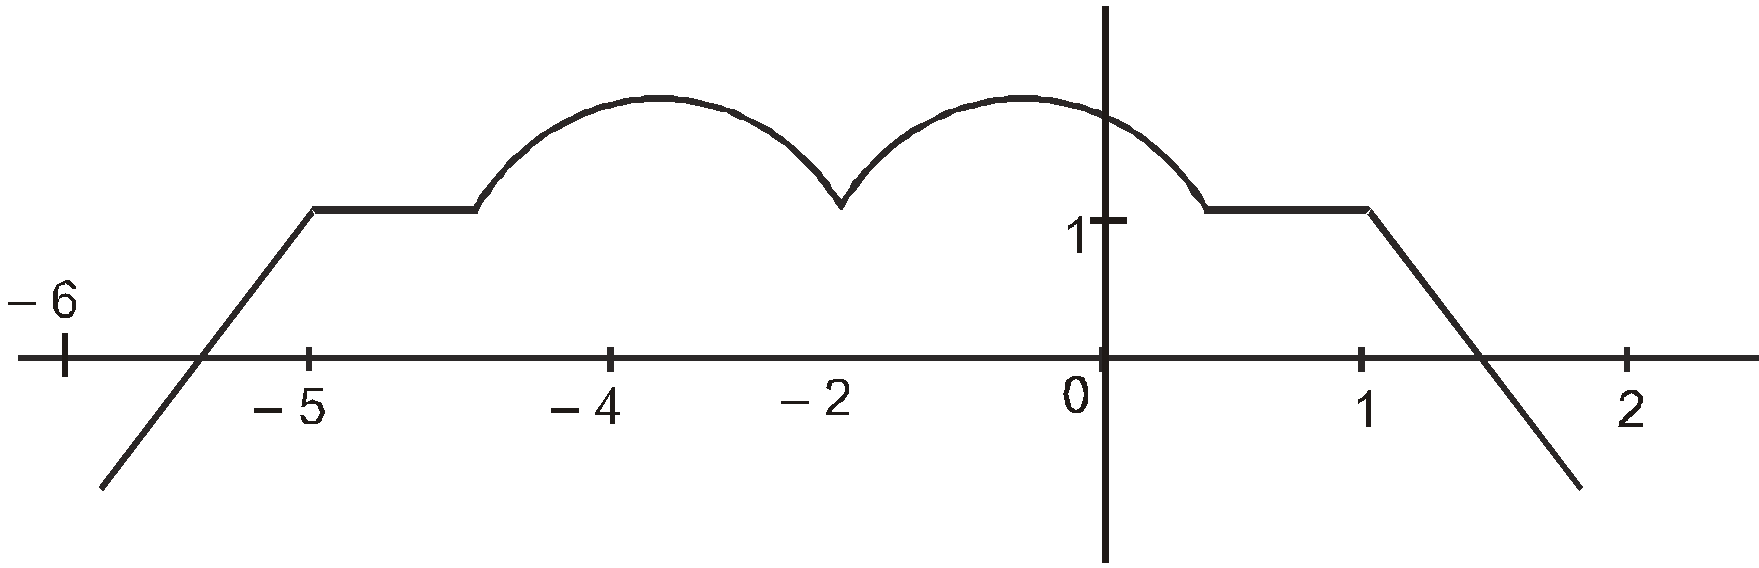
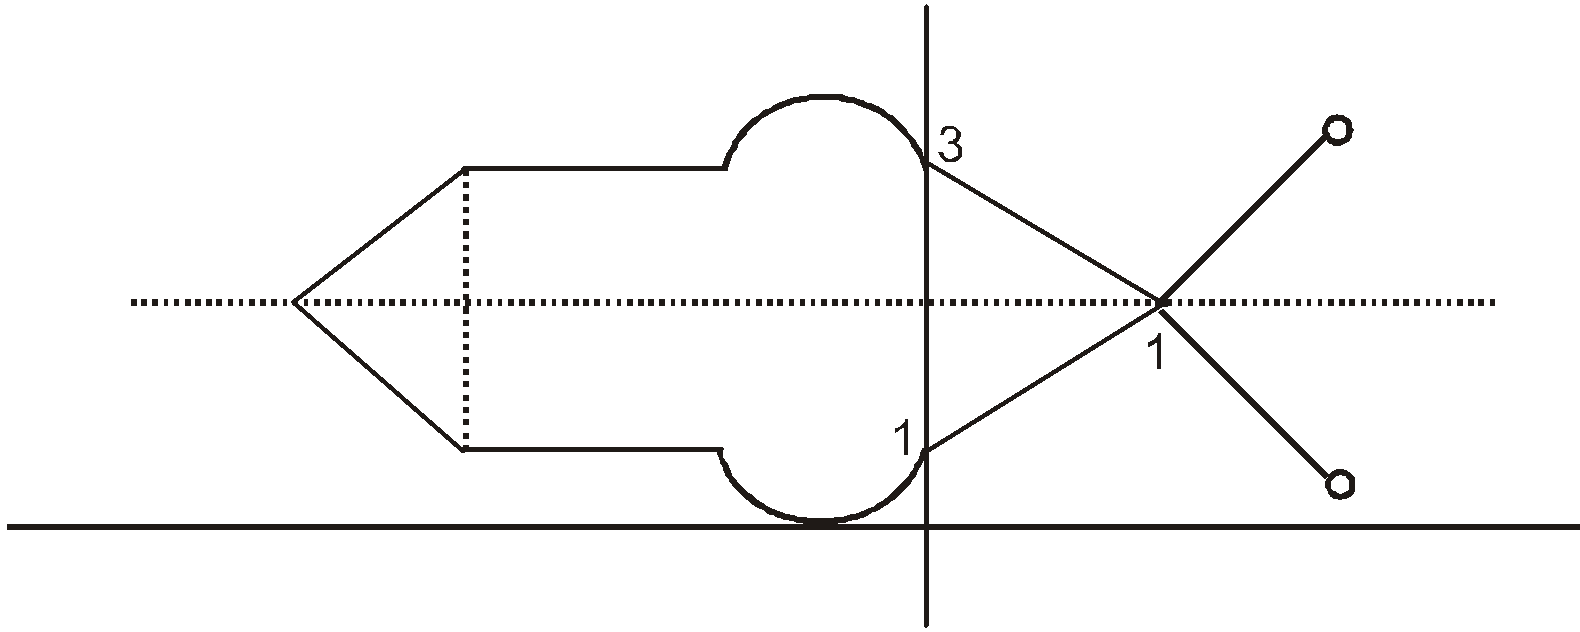
If y = f(x) is shown in figure given below, then plots the graph for
A
y = f(|x + 2|)
B
|y – 2| = f(–3x). 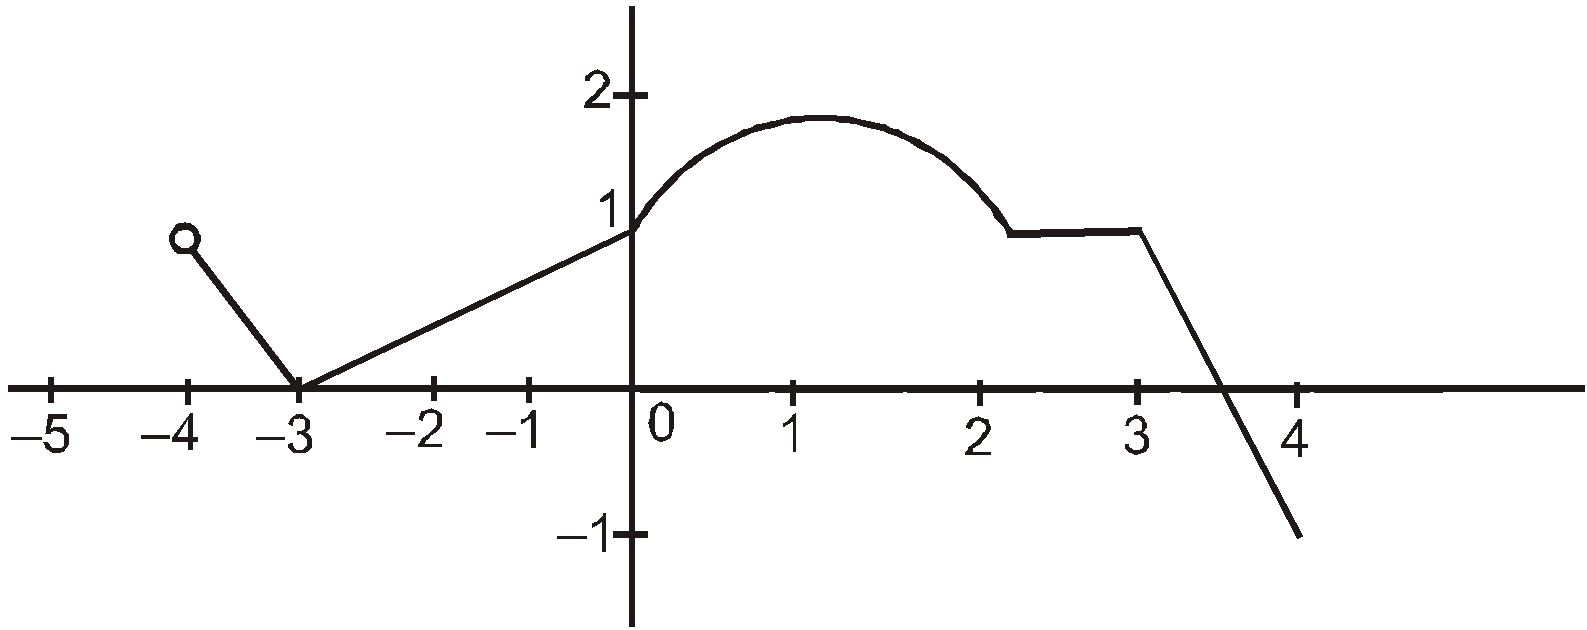
Text Solution
Verified by ExpertsThe correct answer is:
CHECK THE SOLUTION.
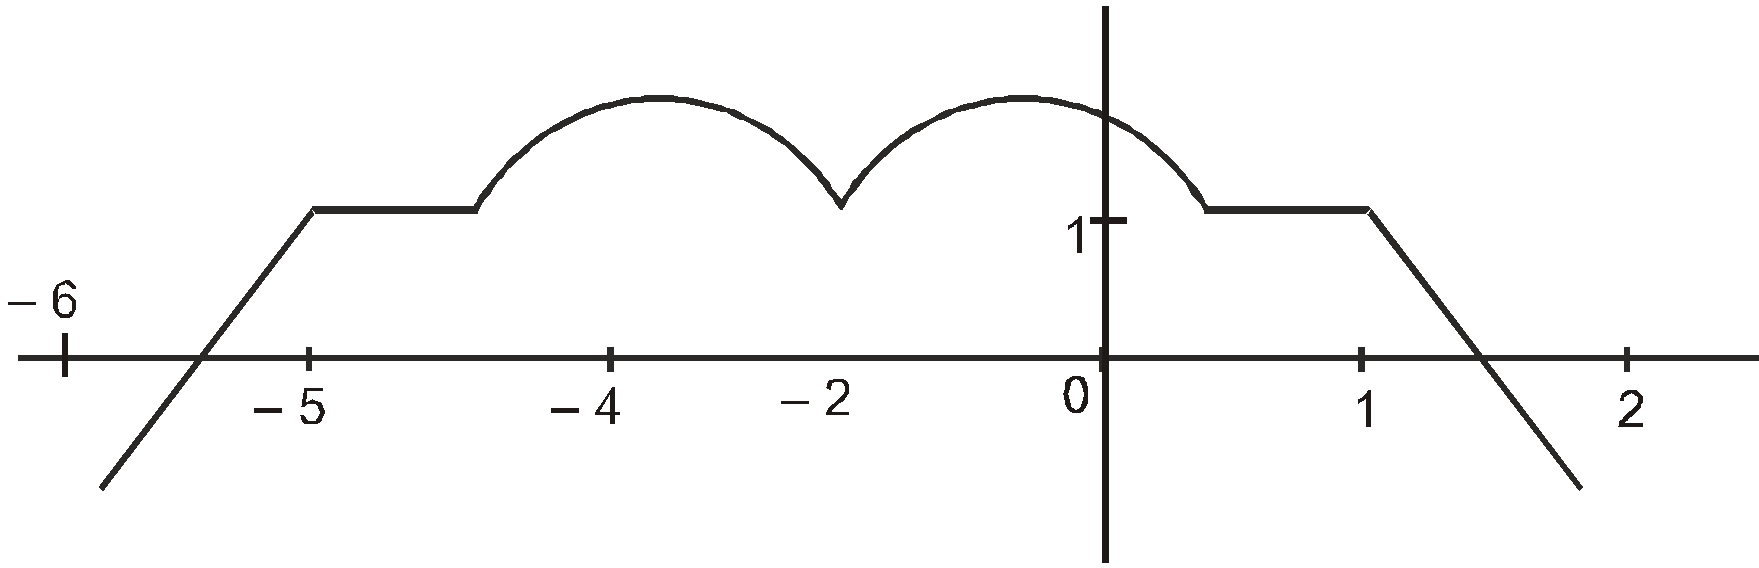
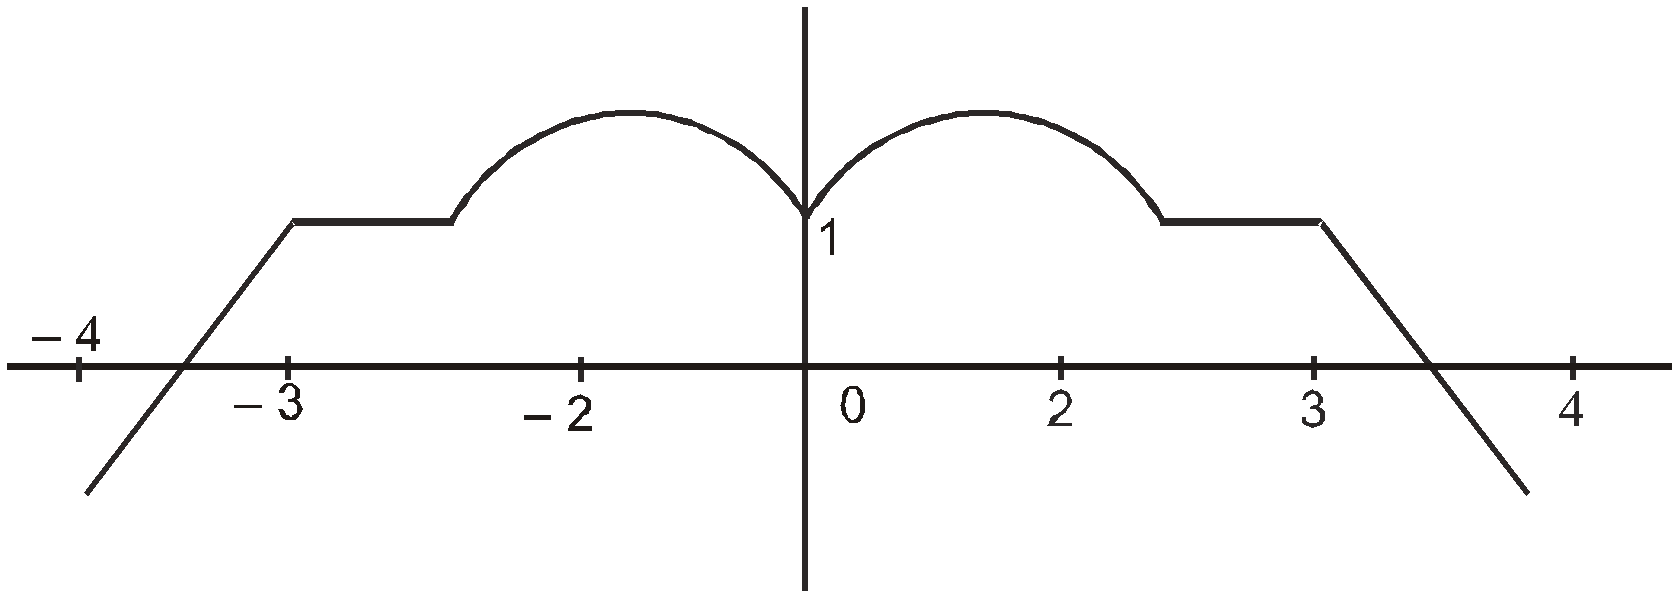
Sol. y = f(|x|)
replace x by x + 2 we get
graph of
y = f(|x + 2|)
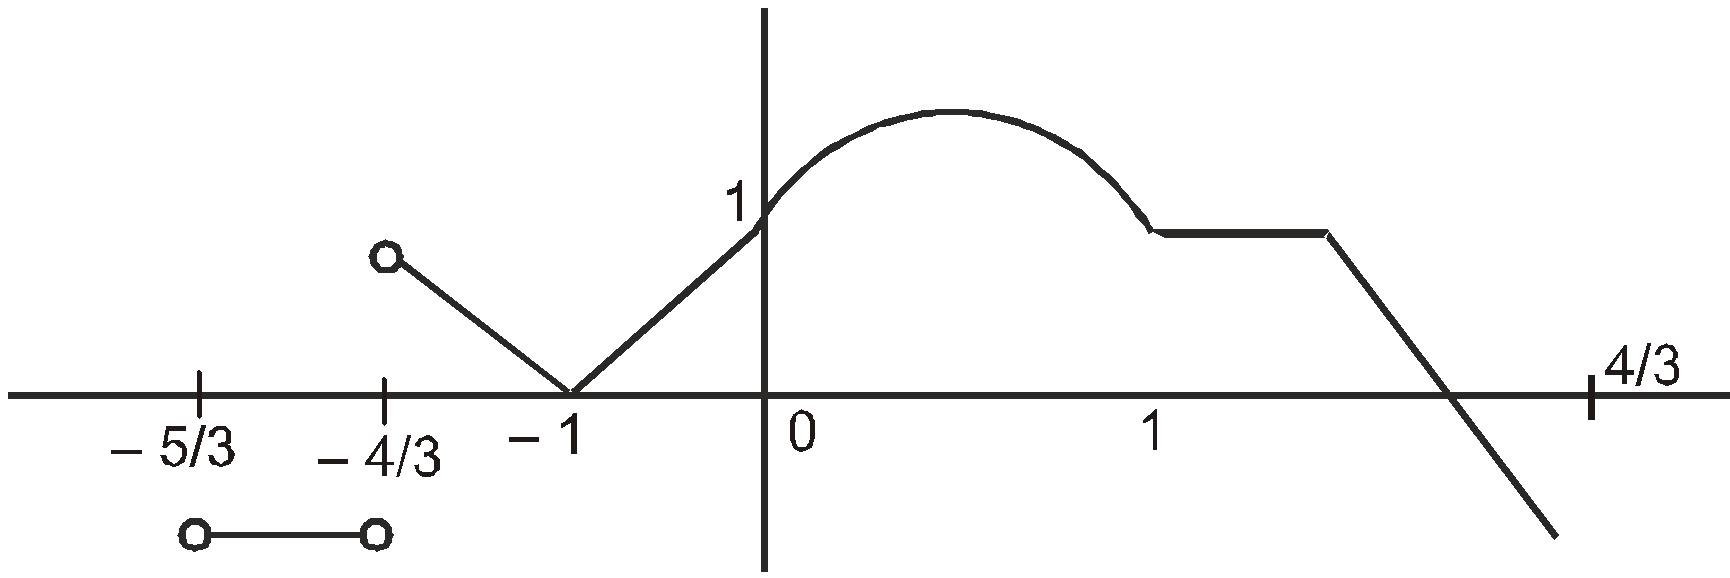
y = f(3x)
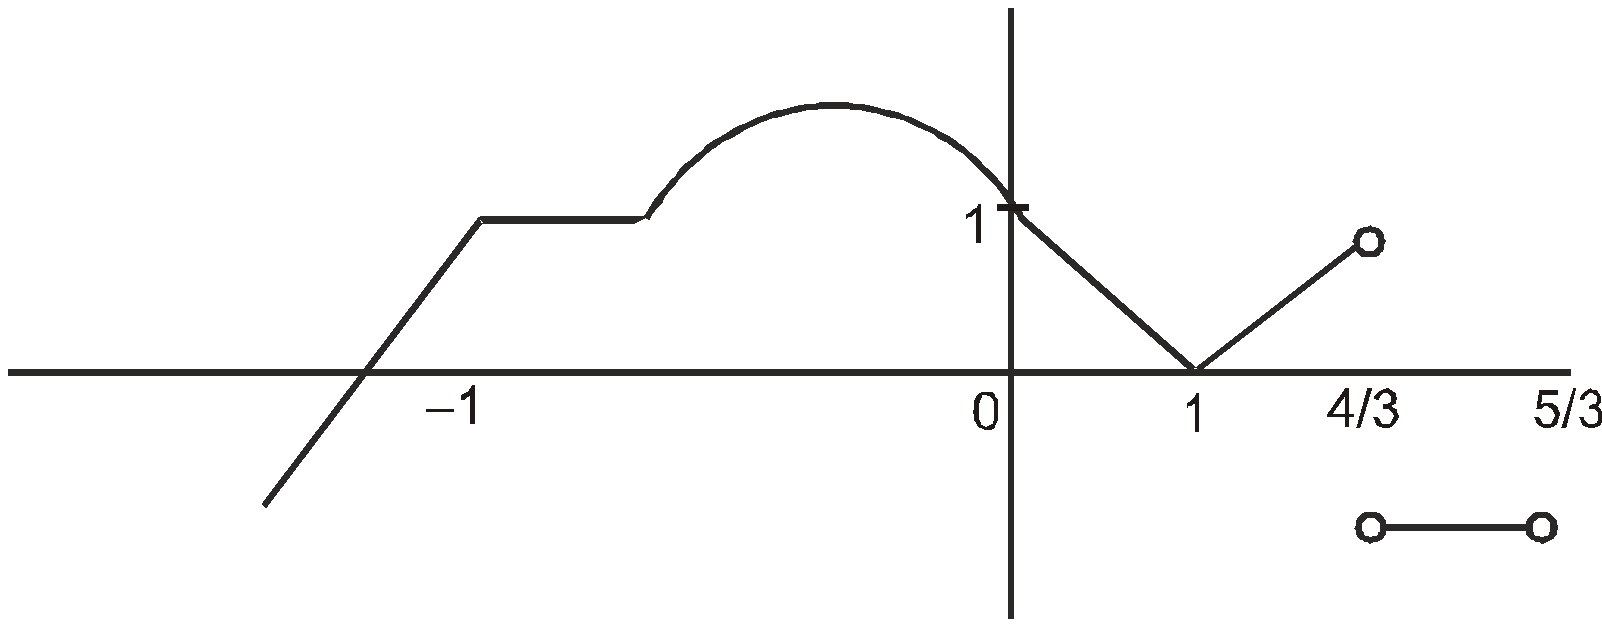
y = f(– 3x)
|y| = f(– 3x)
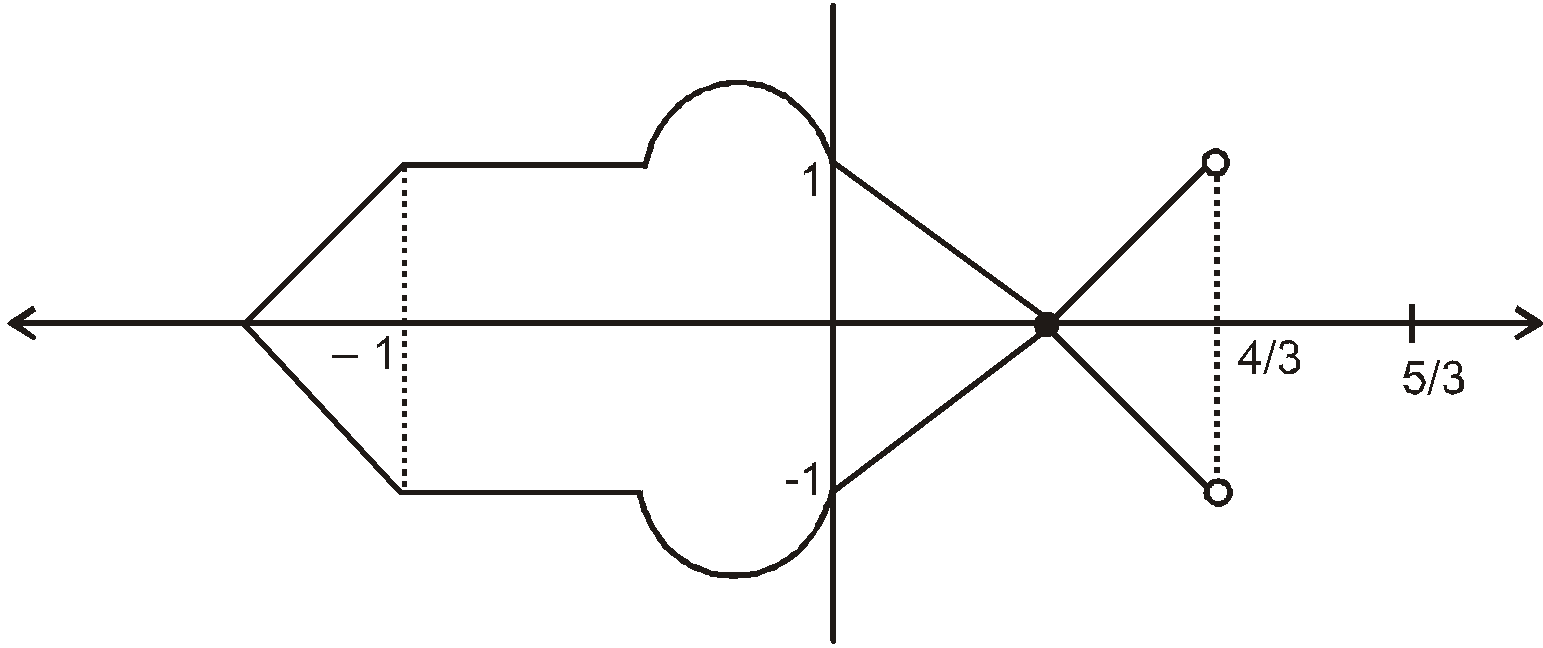
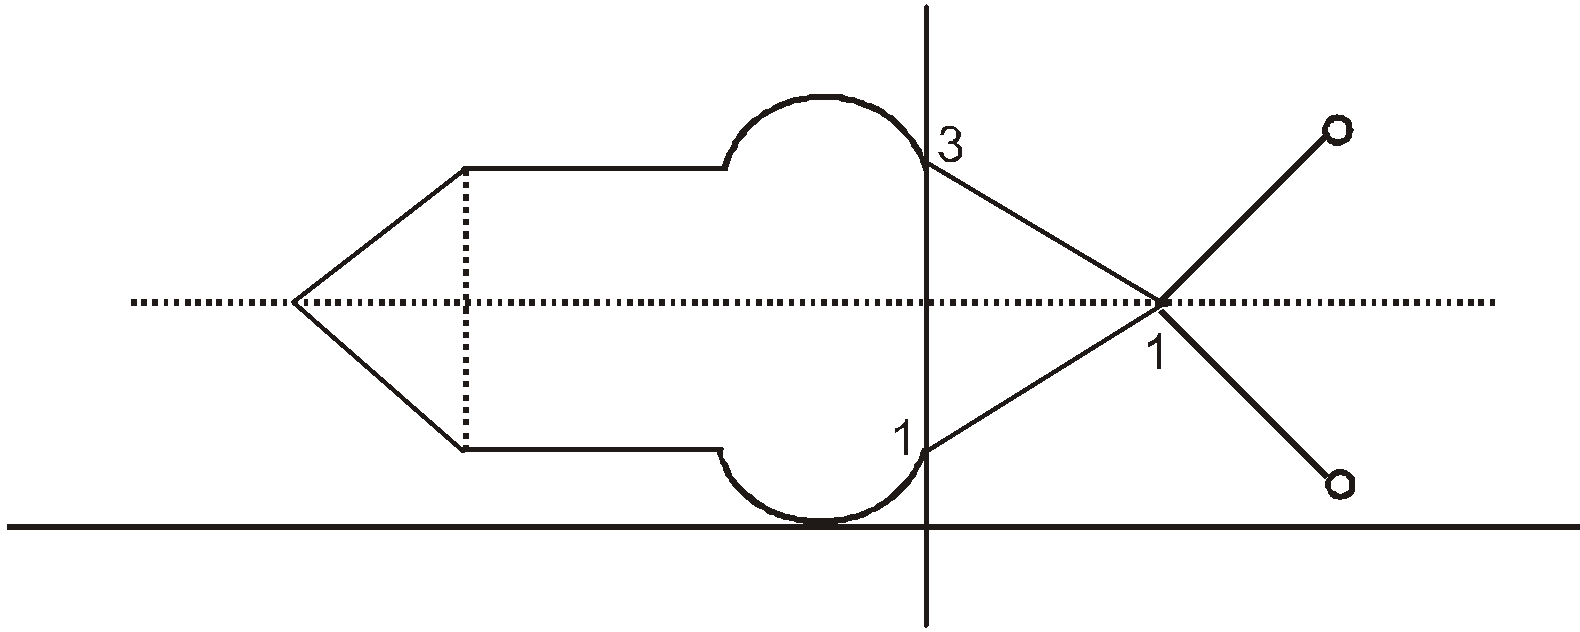
|y – 2| = f(– 3x)
──────────────────────────────────────────────────────────────────────────────────────────
Prepare Smarter with CGP Edu
Get practice questions, solutions, and test series in one place.
Write a Review
Share your experience with this question and solution.
Commentary
Send your comment, doubt, correction, or feedback to admin.
Similar Questions
Explore conceptually related problems
Draw the graph of followings —
(i)y = – |x + 2|
(ii)y = | | x – 1 | – 2|
(iii)y = |x + 2| + |x – 3|…
Draw the graphs of the following curves :
(i) y =
(ii) = – 1
(iii) |y – 3| = |x – 1|
(iv) y = …
Draw the graph of y = log 1/2 (1 – x).
Find the set of values of λ for which the equation |x 2 – 4|x| – 12| = λ has 6 distinct real roots
If y = f(x) has following graph
Then draw the graph of
(ii) y = f(|x|)
(iii) y = f(– |x|)
(iv) y =…
Find the number of roots of equation
(i) 3 |x| – |2 – |x|| = 1
(ii) x + 1 = x · 2 x