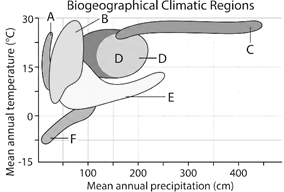
Biome distribution is shown with respect to annual temperature and precipitation. Correctly identify the biomes.
Tropical forest | Desert | Coniferous forest | |
(a) | D | B | F |
(b) | C | A | E |
(c) | E | B | F |
(d) | F | A | C |
Text Solution
Verified by ExpertsB
This is the standard Whittaker biome distribution graph (Temperature vs Precipitation).
= Desert (high temperature, very low rainfall)
= Tropical forest (high temperature, very high rainfall)
(E) = Coniferous forest (moderate rainfall, cooler temperatures)
Therefore:
- Tropical forest
– Desert
(E) - Coniferous forest
──────────────────────────────────────────────────────────────────────────────────────────
Prepare Smarter with CGP Edu
Get practice questions, solutions, and test series in one place.
Write a Review
Share your experience with this question and solution.
Commentary
Send your comment, doubt, correction, or feedback to admin.
Similar Questions
Explore conceptually related problems