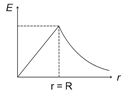
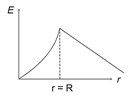
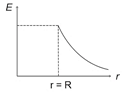
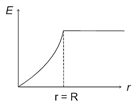
Graphical variation of electric field due to a uniformly charged insulating solid sphere of radius R, with distance r from the center O is represented by:
A
B
C
D
Text Solution
Verified by ExpertsThe correct answer is:
A
The electric field inside a solid insulated sphere is given by
 for r < R where p is volume charge density. Hence, the electric field varies linearly with the distance as

Now, the electric field for r > R is given by w
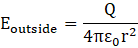

Thus, the graph starts decreasing as a power law graph as shown in the figure for the region r > R. Hence, this graph is the right option.
Prepare Smarter with CGP Edu
Get practice questions, solutions, and test series in one place.
Write a Review
Share your experience with this question and solution.
Commentary
Send your comment, doubt, correction, or feedback to admin.
Similar Questions
Explore conceptually related problems
Experimentally it is found that 12. 8 eV energy is required to separate a hydrogen atom into a prot…
An electric dipole of dipole moment is 6. 0 x 10 -6 C m placed in a uniform electric field of 1.5 x…
<p>Three concentric spherical metallic shells JC, Y and Z of radius a, b and c respectively [a <…
An electron revolves around an infinite cylindrical wire having uniform linear charge density 2 x 1…
As shown in the figure, a configuration of two equal point charges (q Q = +2 µC) is placed on an in…
A thin infinite sheet charge and an infinite line charge of respective charge densities + and + a…