Published by:
CGP EDU Academic Team
Published on: August 11, 2026
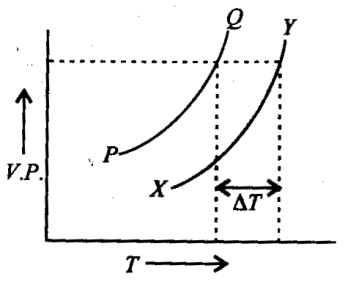
In the graph plotted between vapour pressure (V. P) and temperature 
A
PQ is the curve for solvent , XY is the curve of solution and  is depression in freezing point
is depression in freezing point
B
PQ is the curve for solvent XY is the curve for solvent and  is elevation in boiling point.
is elevation in boiling point.
C
PQ is the curve for solvent XY is the curve for solution and is molal elevation in boiling point
D
PQ is the curve for solvent XY is the curve for solution and  is elevation in boiling point.
is elevation in boiling point.
Text Solution
Verified by ExpertsThe correct answer is:
D
PQ corresponds to increase in vapour pressure of solvent with temperature and XY, corresponds to increase in vapour pressure of solution with temperature.  is the elevation in boiling point of a solution.
Prepare Smarter with CGP Edu
Get practice questions, solutions, and test series in one place.
Write a Review
Share your experience with this question and solution.
Commentary
Send your comment, doubt, correction, or feedback to admin.
Similar Questions
Explore conceptually related problems
On adding solute to a solvent having vapour pressure 0.80 atm , vapour pressure reduces to 0.60 atm…
A solution containing 30 gms of non-volatile solute in exactly 90 gm water has a vapour pressure of…
Vapour pressure of a solution of of non- electrolyte in of water at a particular temperature is …
Azeotropic mixture of HCl and water has
The osmotic pressure at of an aqueous solution containing 1.75 g of sucrose per 150 ml solution is
A 1.2 of solution of NaCl is isotonic with 7.2 of solution of glucose. Calculate the van’t Hoff’s f…