Published by:
CGP EDU Academic Team
Published on: August 12, 2026
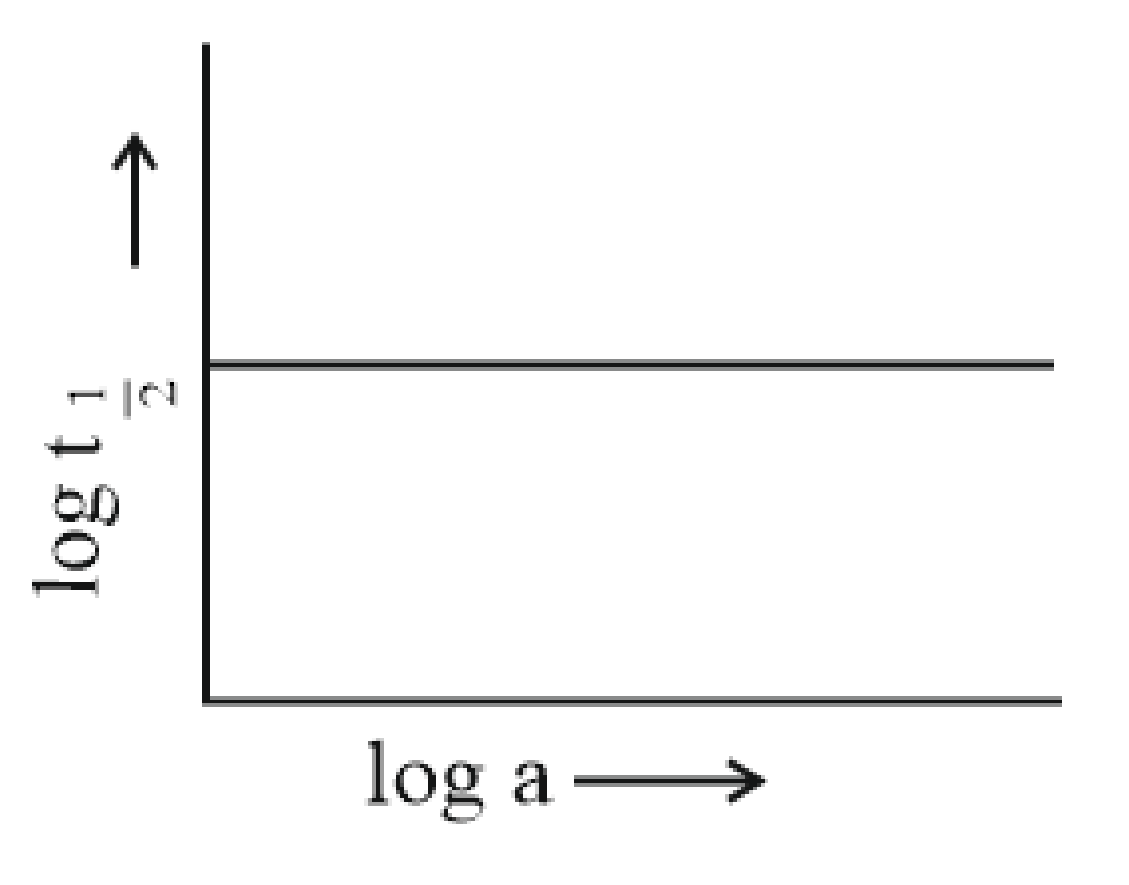
A graph plotted between  vs. log concentration is a straight line. What conclusion can you draw from the given graph
A

B

C
n = 1, 
D
none of these
Text Solution
Verified by ExpertsThe correct answer is:
C


or 

so slope = 1 - n
or 1-n = 0 or n = 1
Prepare Smarter with CGP Edu
Get practice questions, solutions, and test series in one place.
Write a Review
Share your experience with this question and solution.
Commentary
Send your comment, doubt, correction, or feedback to admin.
Similar Questions
Explore conceptually related problems
Following is the graph between log and log a (a = initial concentration of reactant) for a given r…
The rate of decomposition for methyl nitrite and ethyl nitrite can be given in terms of rate consta…
Find the rate law that corresponds to the data shown for the following reaction?
Experiment[A]0=M[B…
The half-life period for catalytic decomposition of AB 3 at 50 mm is found to be 4 hrs and at 100 m…
For the reaction mechanism of the reaction 2 NO(g) + 2 H 2 (g) N 2 (g) + 2 H 2 O(g).
Step I ;
St…
For reactions A B and P Q Arrhenius constants are 10 8 and 10 10 respectively. If = 600 cal/mole…