Published by:
CGP EDU Academic Team
Published on: August 11, 2026
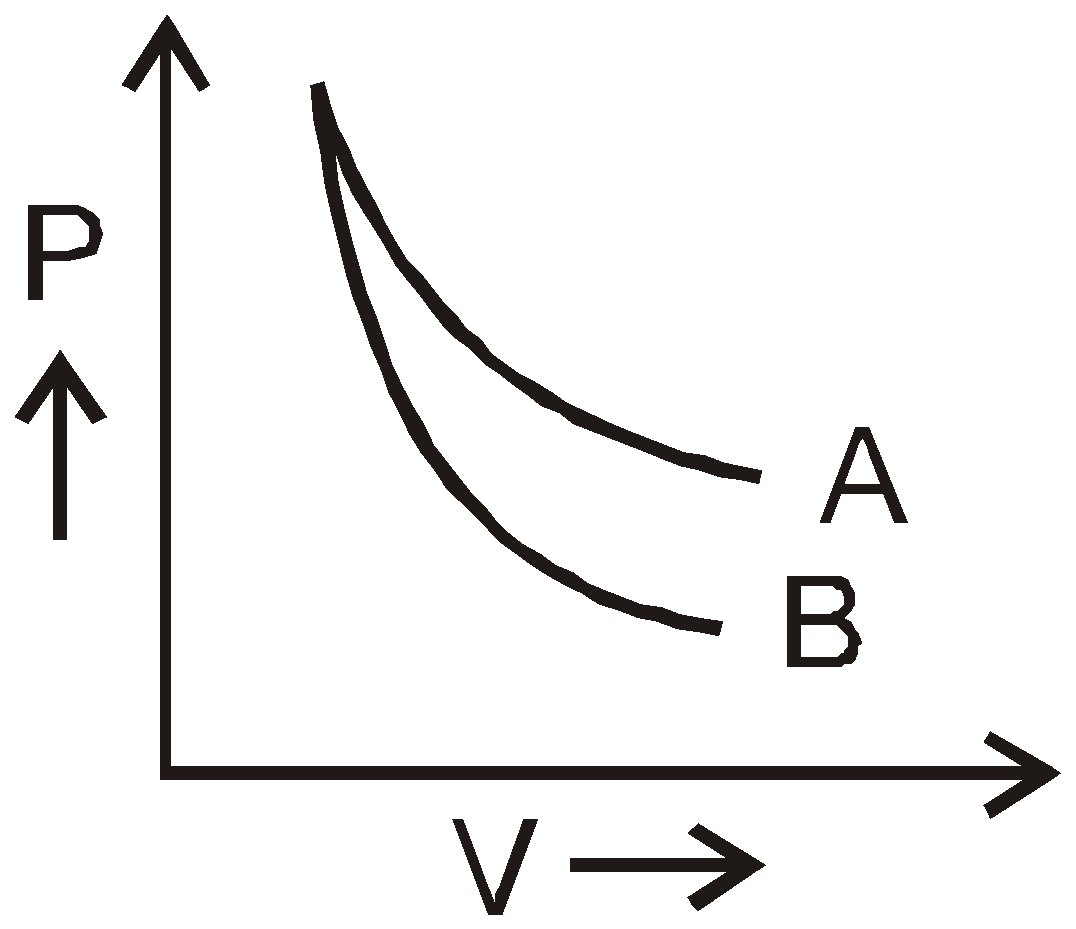
P-V plot for two gases (assuming ideal) during adiabatic processes are given in the figure. Plot A and plot B should correspond respectively to :
Text Solution
Verified by ExpertsThe correct answer is:
CHECK THE SOLUTION.
(b,c,d)
PV = constant for isothermal proces
PV γ = constant for adiabatic process so more
Value of γ , more decrease in pressure as volume increases
Prepare Smarter with CGP Edu
Get practice questions, solutions, and test series in one place.
Write a Review
Share your experience with this question and solution.
Commentary
Send your comment, doubt, correction, or feedback to admin.
Similar Questions
Explore conceptually related problems
Match the column:
Columm-IColumm-II (a)Reversible isothermal expansion of an ideal gas(p)w = –2.303…
Match the column:
Column-IColumn-II(a)A process carried out infinitesimally slowly(p)Adiabatic(b)A …
How many statements are false ?
(i) Thermodynamics is concerned only with total energy of the syste…
How many of the following physical properties are extensive :
(i) Free energy (ii) vapour pressure
…
How many of the following are state function :
(i) Internal energy (ii) Heat
(iii) Enthalpy (iv) En…
Two moles of He gas ( γ = 5/3) are initially at temp 27ºC and occupy a volume of 20 litres. The gas…