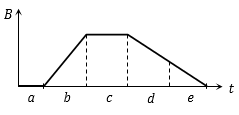
The graph gives the magnitude B(t) of a uniform magnetic field that exists throughout a conducting loop, perpendicular to the plane of the loop. Rank the five regions of the graph according to the magnitude of the emf induced in the loop, greatest first
Text Solution
Verified by ExpertsThe correct answer is:
B
Induced emf 
i.e.  slope of
  graph
graph 
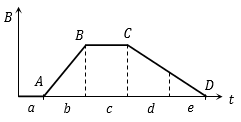
In the given graph slope of  slope of
  , slope in the '
  ' region
  slope in the '
  ' region
  , slope in the '
  ' region
  slope in the '
  ' region
  . That's why
Prepare Smarter with CGP Edu
Get practice questions, solutions, and test series in one place.
Write a Review
Share your experience with this question and solution.
Commentary
Send your comment, doubt, correction, or feedback to admin.
Similar Questions
Explore conceptually related problems
The current in a coil changes from 4 ampere to zero in 0.1 s. If the average e.m.f. induced is 100 …
If in a coil rate of change of area is second and current become 1 amp from 2 amp in . If magnitu…
An e.m.f. of 12 volt is produced in a coil when the current in it changes at the rate of 45 amp/min…
An average induced e.m.f. of 1V appears in a coil when the current in it is changed from 10A in one…
If a change in current of 0.01 A in one coil produces a change in magnetic flux in the other coil,…
A solenoid of length l meter has self-inductance L henry. If number of turns are doubled, its self-…