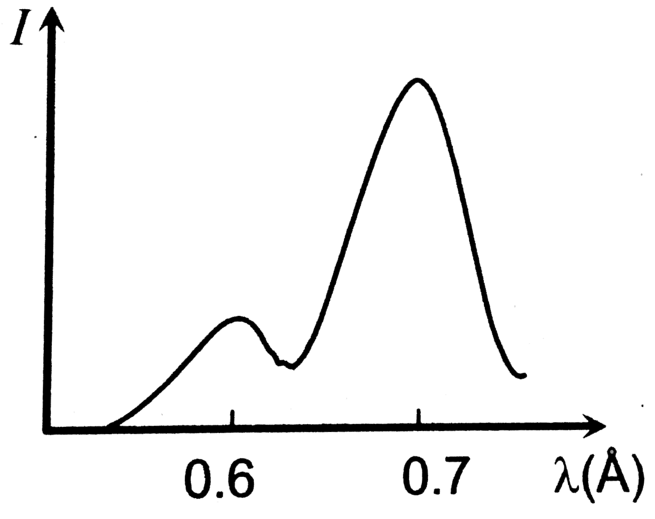
In the diagram a graph between the intensity of X-rays emitted by a molybdenum target and the wavelength is shown, when electrons of 30 keV are incident on the target. In the graph one peak is of K α line and the other peak is of K β line
Text Solution
Verified by ExpertsThe correct answer is:
B
Peak of  is greater than peak of
  line.
line.
Prepare Smarter with CGP Edu
Get practice questions, solutions, and test series in one place.
Write a Review
Share your experience with this question and solution.
Commentary
Send your comment, doubt, correction, or feedback to admin.
Similar Questions
Explore conceptually related problems
A beam of protons with a cross-sectional area of is moving with a velocity of . Then charge dens…
A particle of mass at rest decays into two particles of masses and , having non-zero velocities.…
An image of the sun is formed by a lens of focal length of 30 cm on the metal surface of a photoele…
When an inert gas is filled in the place vacuum in a photocell, then
A photon of 1.7 × × 10 -13 Joules is absorbed by a material under special circumstances. The correc…
The maximum velocity of an electron emitted by light of wavelength incident on the surface of a me…