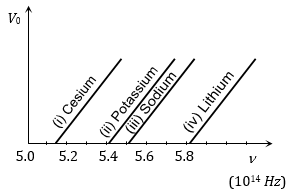
The figure shows different graphs between stopping potential (V 0 ) and frequency (v) for photosensitive surface of cesium, potassium, sodium and lithium. The plots are parallel. Correct ranking of the targets according to their work function greatest first will be
Text Solution
Verified by ExpertsThe correct answer is:
C
The graph between  and
and  cut the
  -axis at
  .
.
For the given graphs


Prepare Smarter with CGP Edu
Get practice questions, solutions, and test series in one place.
Write a Review
Share your experience with this question and solution.
Commentary
Send your comment, doubt, correction, or feedback to admin.
Similar Questions
Explore conceptually related problems
A beam of protons with a cross-sectional area of is moving with a velocity of . Then charge dens…
A particle of mass at rest decays into two particles of masses and , having non-zero velocities.…
An image of the sun is formed by a lens of focal length of 30 cm on the metal surface of a photoele…
When an inert gas is filled in the place vacuum in a photocell, then
A photon of 1.7 × × 10 -13 Joules is absorbed by a material under special circumstances. The correc…
The maximum velocity of an electron emitted by light of wavelength incident on the surface of a me…