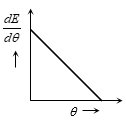
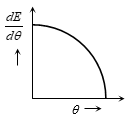
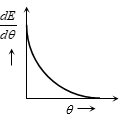
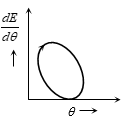
Which of the following graphs shows the variation of thermoelectric power with temperature difference between hot and cold junction in thermocouples
A
B
C
D
Text Solution
Verified by ExpertsThe correct answer is:
A
Thermo electric power 
Comparing it with  option is correct.
Prepare Smarter with CGP Edu
Get practice questions, solutions, and test series in one place.
Write a Review
Share your experience with this question and solution.
Commentary
Send your comment, doubt, correction, or feedback to admin.
Similar Questions
Explore conceptually related problems
The resistance of the filament of an electric bulb changes with temperature. If an electric bulb ra…
An immersion heater is rated 836 watt. It should heat 1 liter of water from to in about
In the circuit shown in figure, the heat produced in 5 ohm resistance is 10 calories per second. Th…
A house is served by 220 V supply line in a circuit protected by a 9 ampere fuse. The maximum numbe…
In the circuit as shown in the figure, the heat produced by 6 ohm resistance due to current flowing…
The resistance of a heater coil is 110 ohm. A resistance R is connected in parallel with it and the…