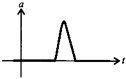
The given acceleration-time graph represents which of the following physical situations?
Text Solution
Verified by ExpertsThe correct answer is:
A
The a – t graph show that initially the body moves with uniform velocity. Its accelerations increases for a short time and then falls to zero and their after the body moves with a constant velocity. Such a physical situations arises when a cricket ball moving with a speed is hit with a bat for a very short time interval.
Prepare Smarter with CGP Edu
Get practice questions, solutions, and test series in one place.
Write a Review
Share your experience with this question and solution.
Commentary
Send your comment, doubt, correction, or feedback to admin.
Similar Questions
Explore conceptually related problems
A person travels along a straight road for half the distance with velocity and the remaining half …
The displacement-time graph for two particles A and B are straight lines inclined at angles of and…
A car travels from A to B at a speed of and returns at a speed of . The average speed of the car …
A boy walks to his school at a distance of 6 km with constant speed of 2.5 km / hour and walks back…
A car travels the first half of a distance between two places at a speed of 30 km/hr and the second…
One car moving on a straight road covers one third of the distance with 20 km/hr and the rest with …