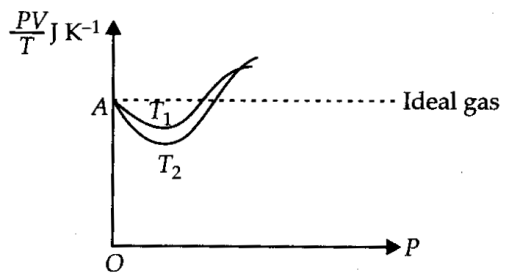
Given is the graph between  and P for 1 g of oxygen gas at two different temperatures T 1 and T 2 , as shown in figure. Given, density of oxygen = 1.427 kg m –3 . The value of PV/T at the point A and the relation between T 1 and T 2 are respectively.
Text Solution
Verified by ExpertsThe correct answer is:
C

Where m = mass of the gas
And  number of moles.
 a constant for all values of P.
That is why, ideally it is a straight line.

Also 
Prepare Smarter with CGP Edu
Get practice questions, solutions, and test series in one place.
Write a Review
Share your experience with this question and solution.
Commentary
Send your comment, doubt, correction, or feedback to admin.
Similar Questions
Explore conceptually related problems
In the relation , n =
A balloon contains of helium at 27° C and 4 atmospheric pressure. The volume of helium at –3° C te…
One litre of helium gas at a pressure 76 cm of Hg and temperature 27° is heated till its pressure a…
The pressure and temperature of an ideal gas in a closed vessel are 720 pka and 40° C respectively.…
A vessels is filled with an ideal gas at a pressure of 10 atmospheres and temperature 27° C . Half …
S.I. unit of universal gas constant is