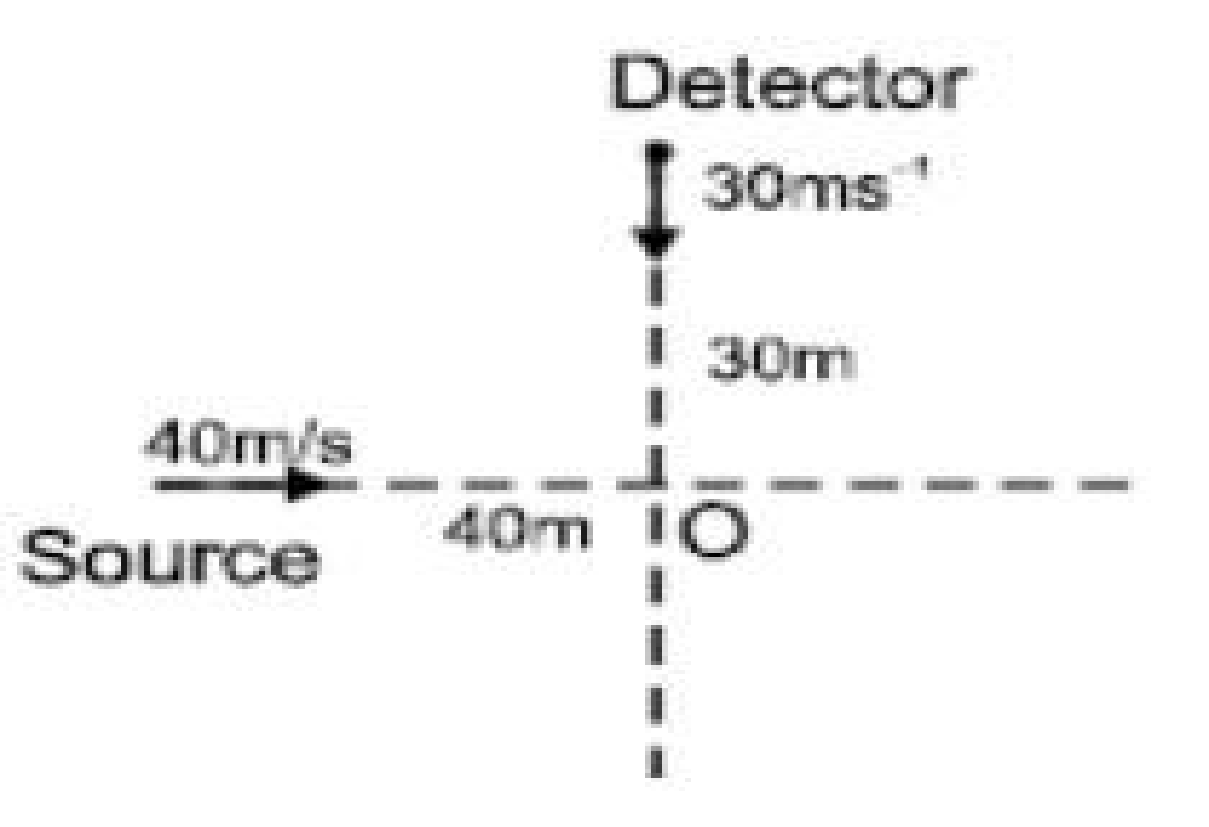
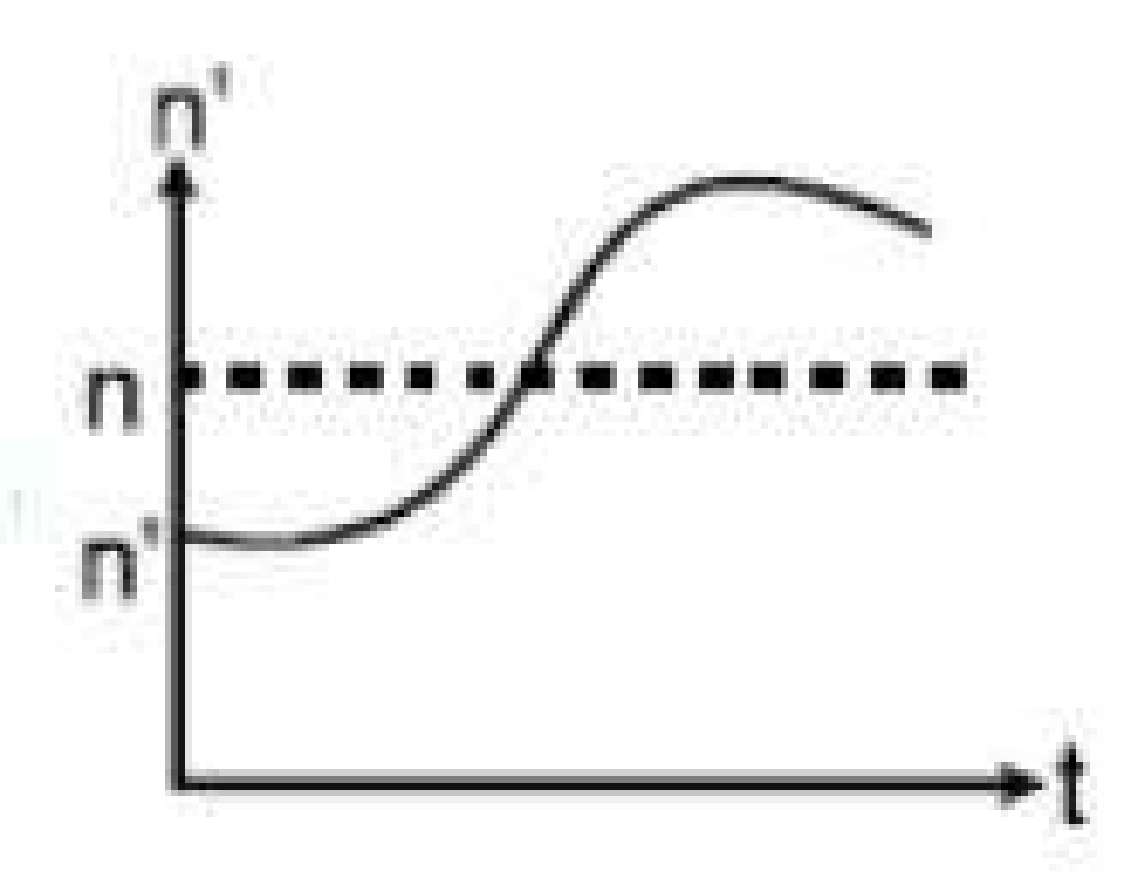
A source and a detector both start moving simultaneously from the position shown in the figure, one along x-axis and the other along y-axis with speeds 40 m s -1 and 30 m s -1 respectively. If n is the frequency of the source then the graph between the apparent frequency n' observed by detector and time t would be [assume that source and detector do not collide]
Text Solution
Verified by ExpertsA
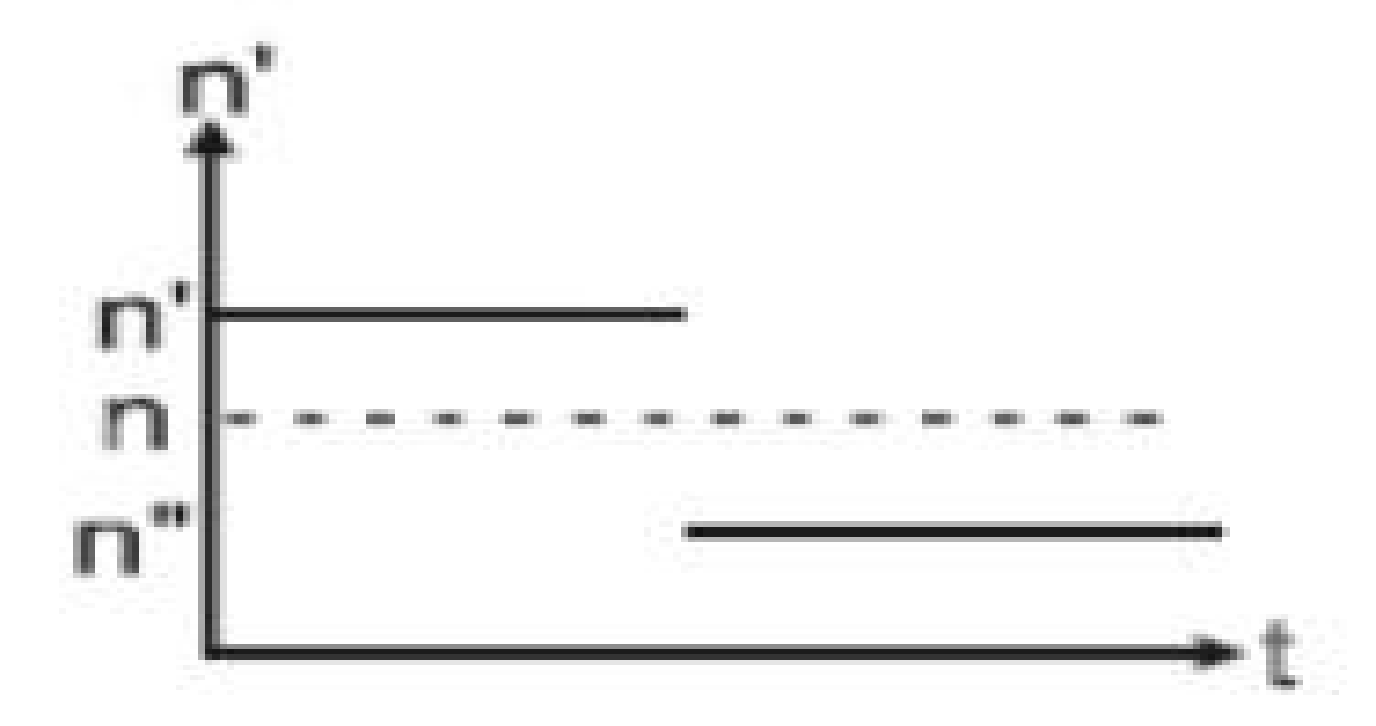
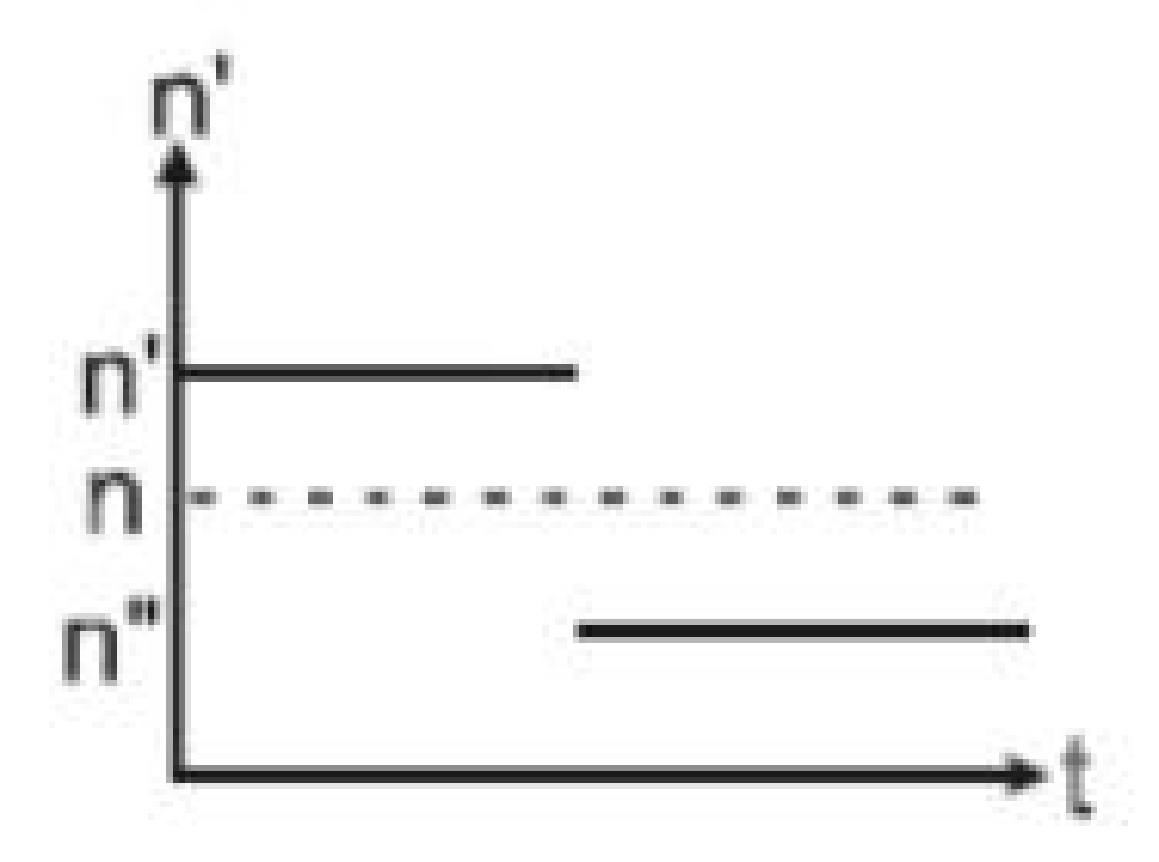
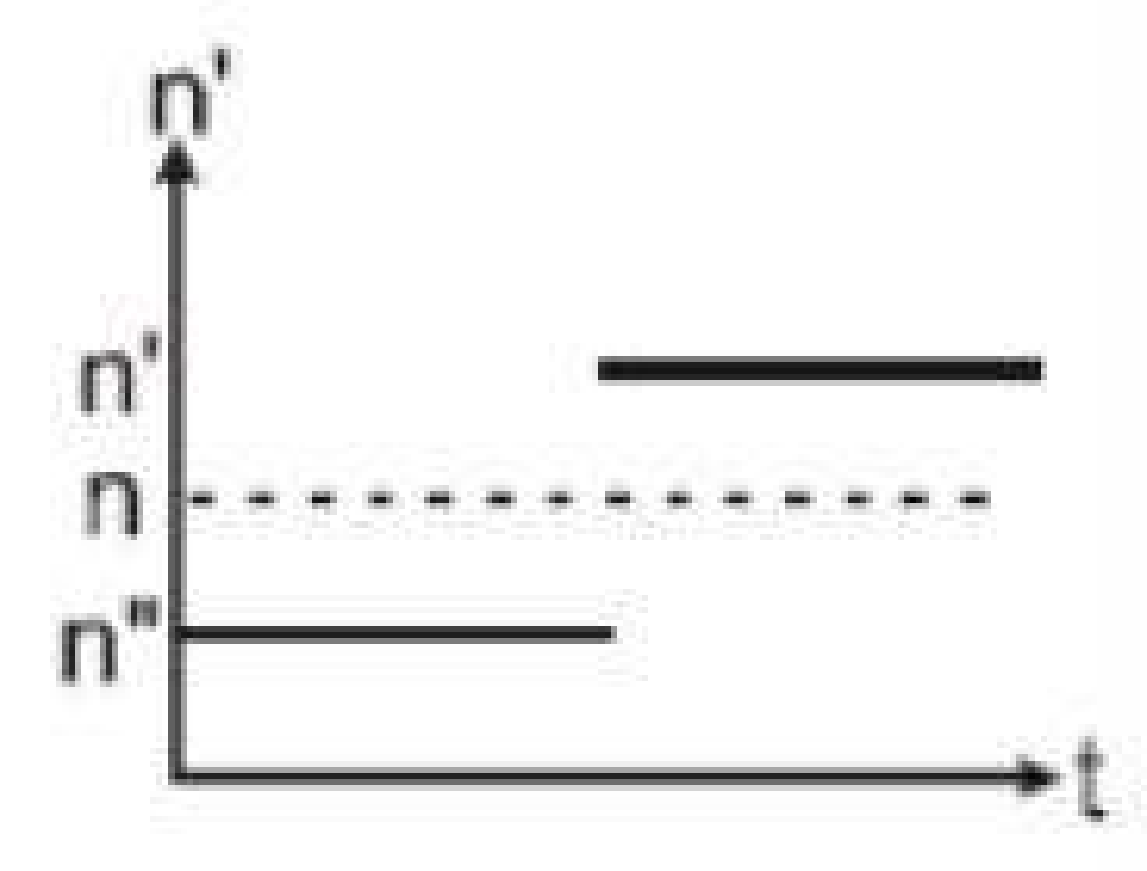
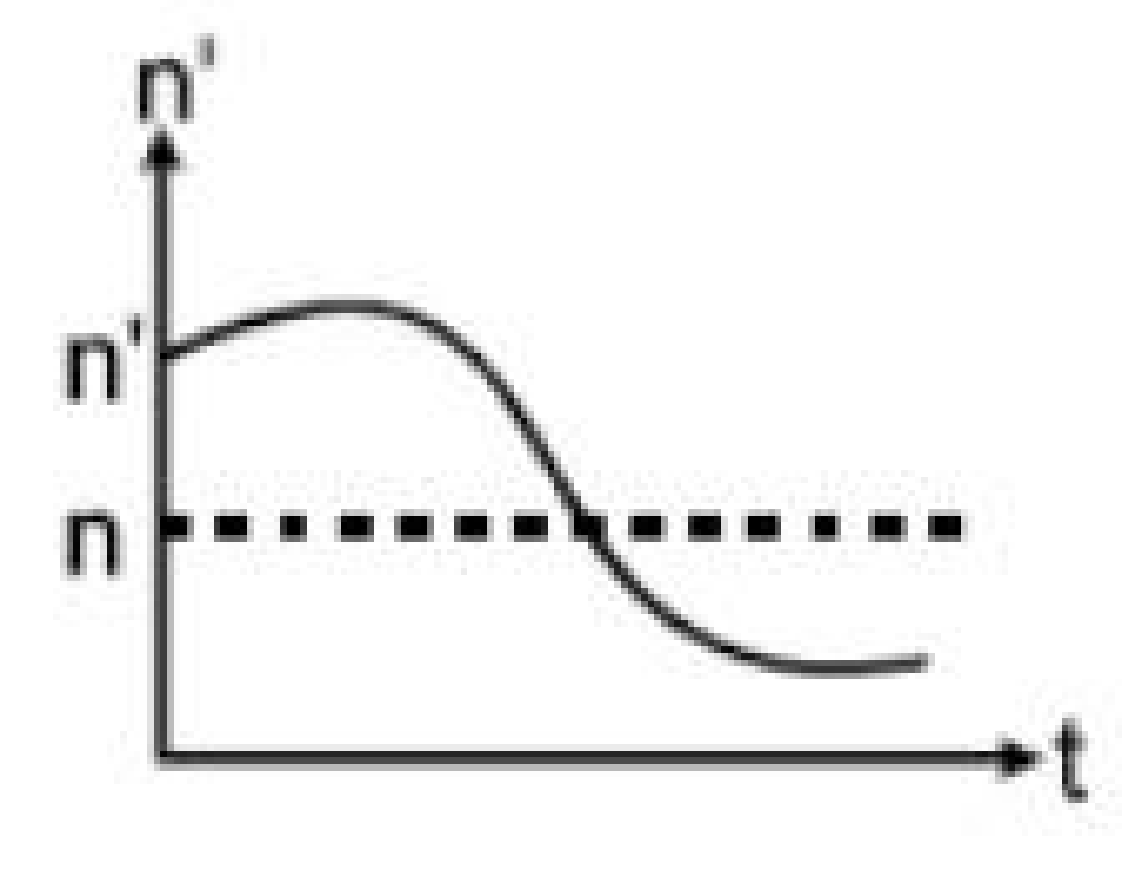
When the source and detector start moving towards the origin then frequency detected by the detector is greater than the original frequency. After crossing origin frequency detected by the detector is less than the original frequency.
We can see from the figure that in one second the source and the detector will be at the origin. After that when they continue their motion, their respective distances from the origin maintains a constant ratio, hence the line joining them remains at a constant angle. So whatever apparent frequency the detector registers, it will remain constant.
Prepare Smarter with CGP Edu
Get practice questions, solutions, and test series in one place.
Write a Review
Share your experience with this question and solution.
Commentary
Send your comment, doubt, correction, or feedback to admin.
Similar Questions
Explore conceptually related problems