Home Physics Kinematics Motion in a Straight Line The speed versus time graph for a particle i…
Physics Kinematics Motion in a Straight Line Subjective Type
Published on: September 12, 2026

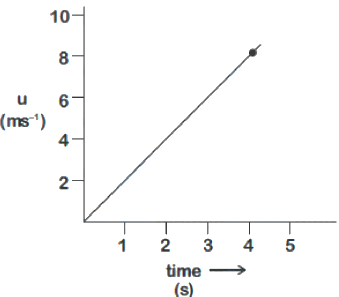
The speed versus time graph for a particle is shown in the figure. The distance travelled (in ) by the particle during the time interval to will be

Share this question

For Instagram sharing, use “Apps” on mobile or copy the link.

Text Solution

Verified by Experts
The correct answer is:
B
Step 1: Identify the area under the speed versus time graph from time \( t = 0 \) to \( t = 5 \) seconds.
Step 2: The graph indicates a linear increase in speed from \( 0 \) to \( 10 \, \text{ms}^{-1} \) over \( 5 \) seconds, representing uniform acceleration.
Step 3: Calculate the area under the graph (which equals the distance traveled). The area of a triangle is given by \( \frac{1}{2} \times \text{base} \times \text{height} \). Here, \( \text{base} = 5 \) seconds and \( \text{height} = 10 \, \text{ms}^{-1} \).
Step 4: Calculate the area (distance):
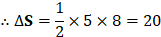
\[ \text{Distance} = \frac{1}{2} \times 5 \times 10 = 25 \, \text{m} \]
Therefore, B.

Prepare Smarter with CGP Edu

Get practice questions, solutions, and test series in one place.

Write a Review

Share your experience with this question and solution.

Commentary

Send your comment, doubt, correction, or feedback to admin.

Student Reviews

What students say about this solution

No reviews yet. Be the first to write a review.

Similar Questions

Explore conceptually related problems

CG
CGP Question Assistant Question Bank + AI Help
Hi! Type your question or upload one screenshot. First I will search related questions from CGP Edu Question Bank. If none match, type YES and I will solve it with AI.
Upload only one screenshot at a time. Flow: Question Bank first → If not matched, type YES for AI solution.