Published by:
CGP EDU Academic Team
Published on: September 12, 2026
A thin rod of length 'L' is lying along the x-axis with its ends at x = 0 and x = L. Its linear density (mass/length) varies with x as
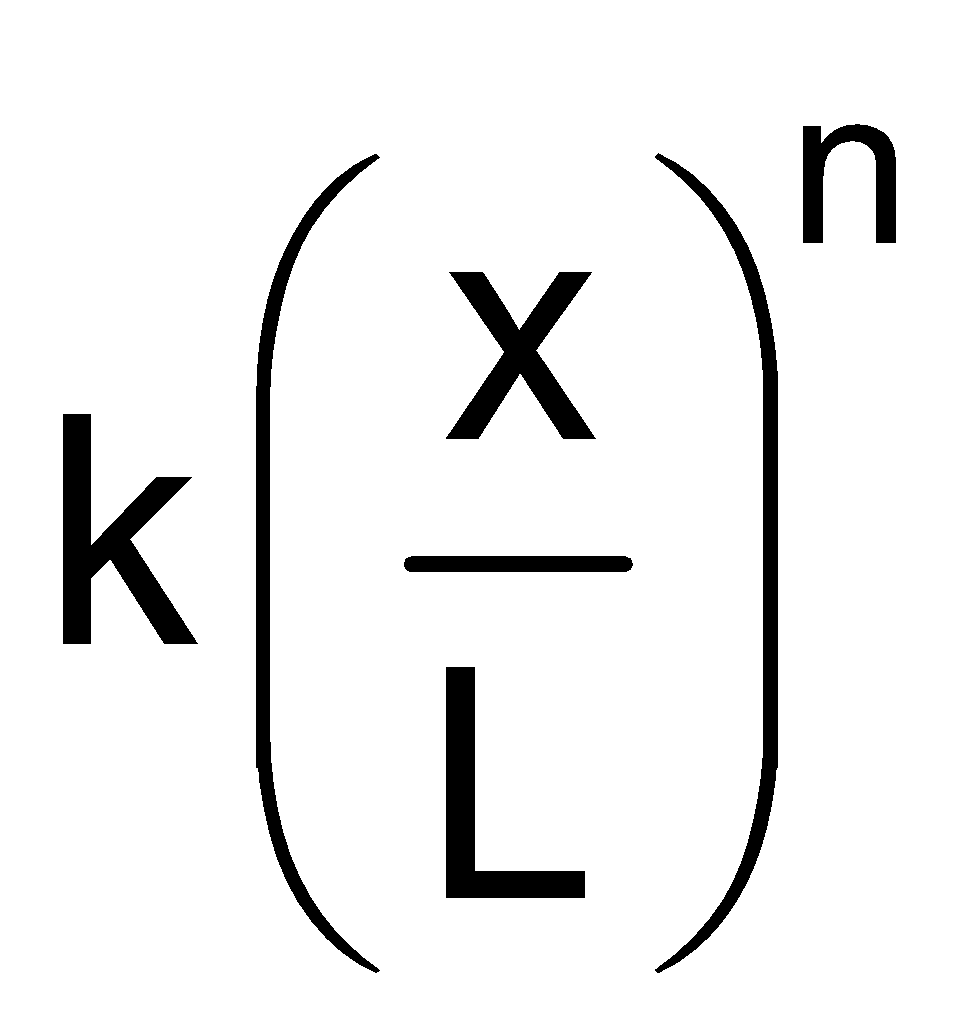
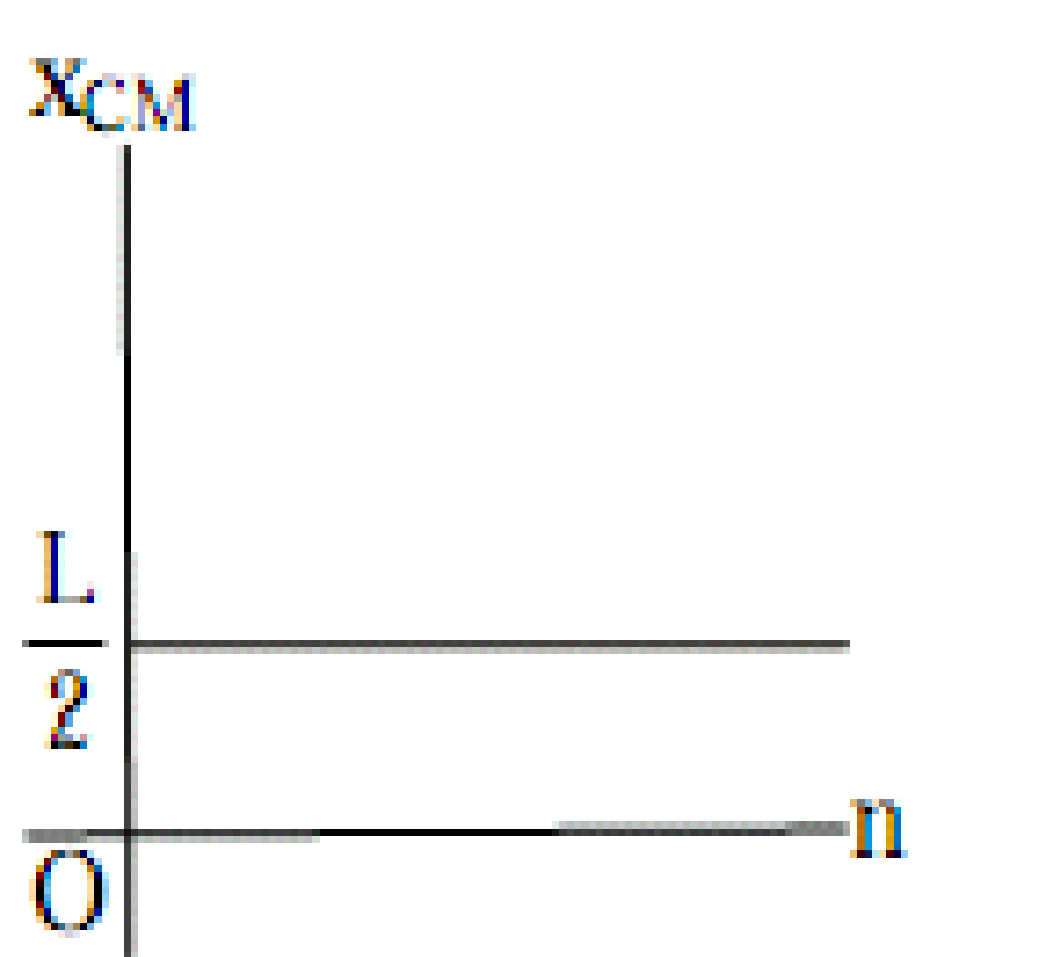
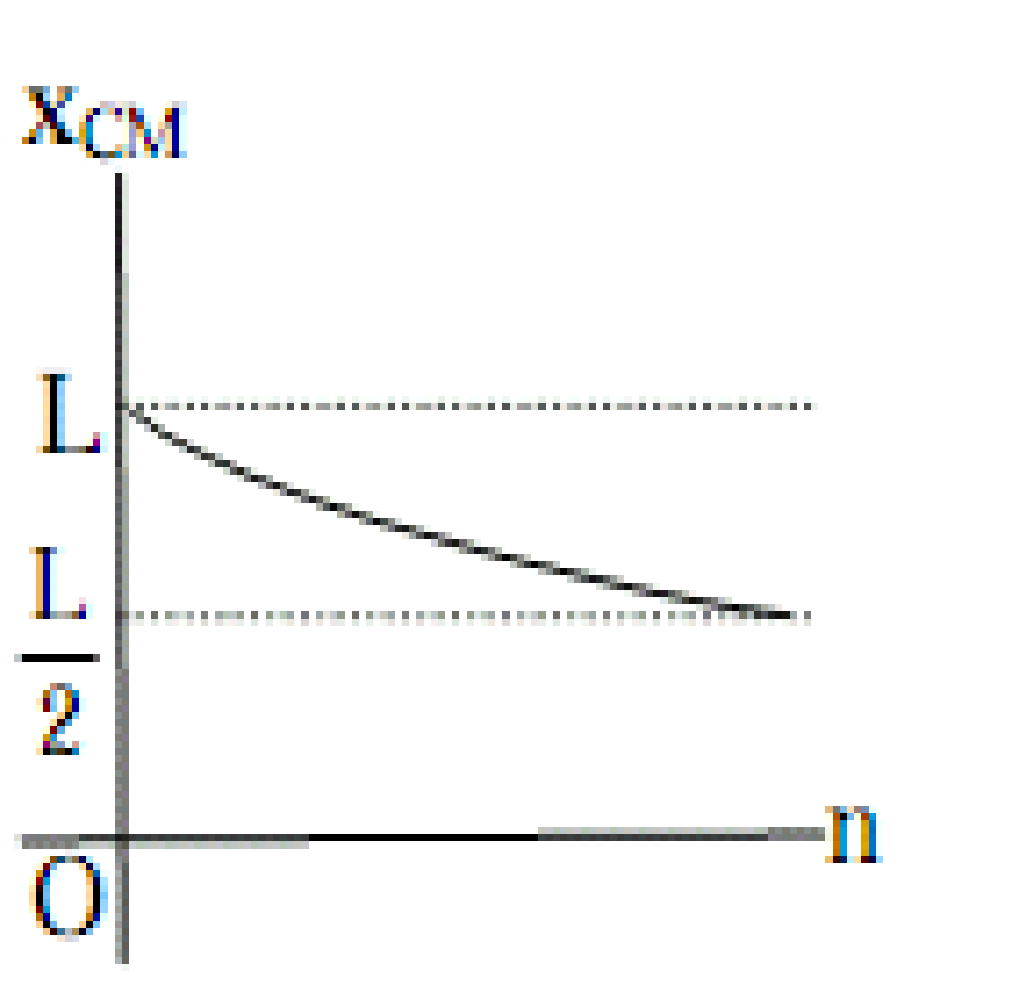
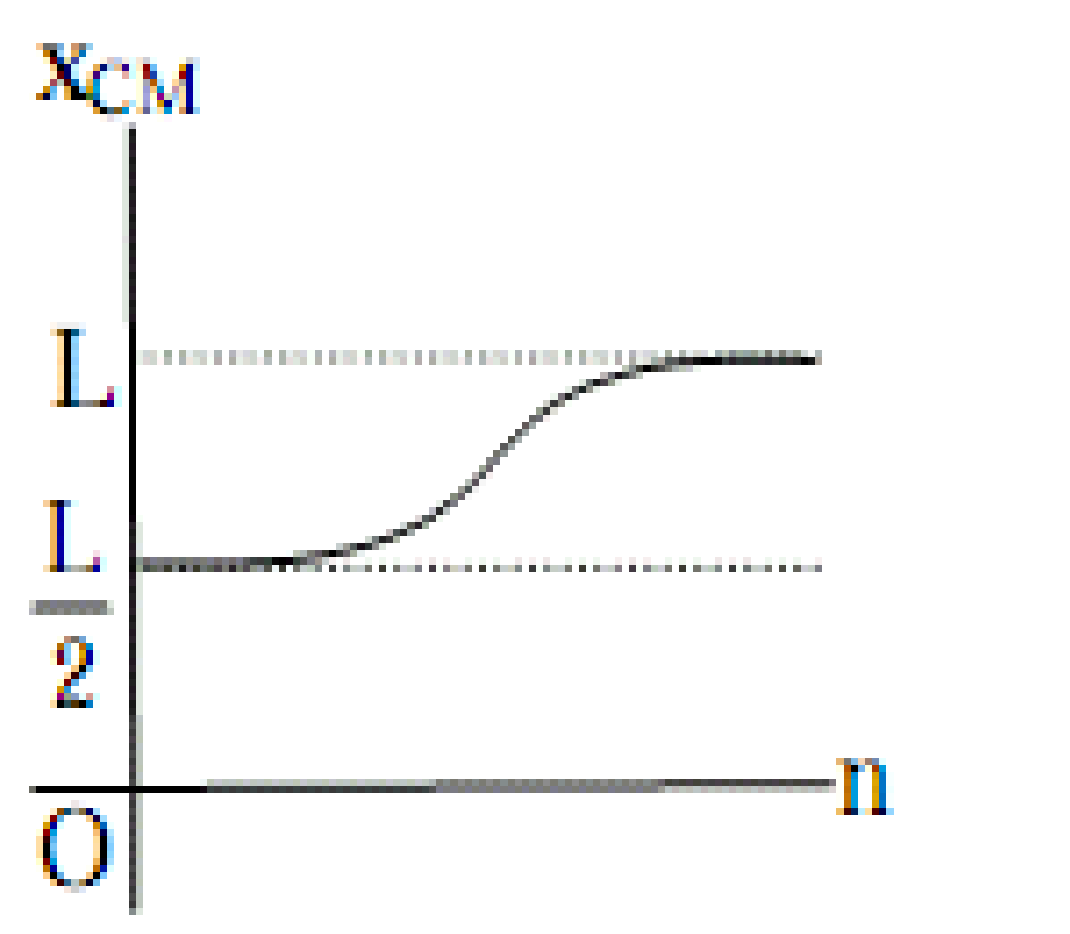
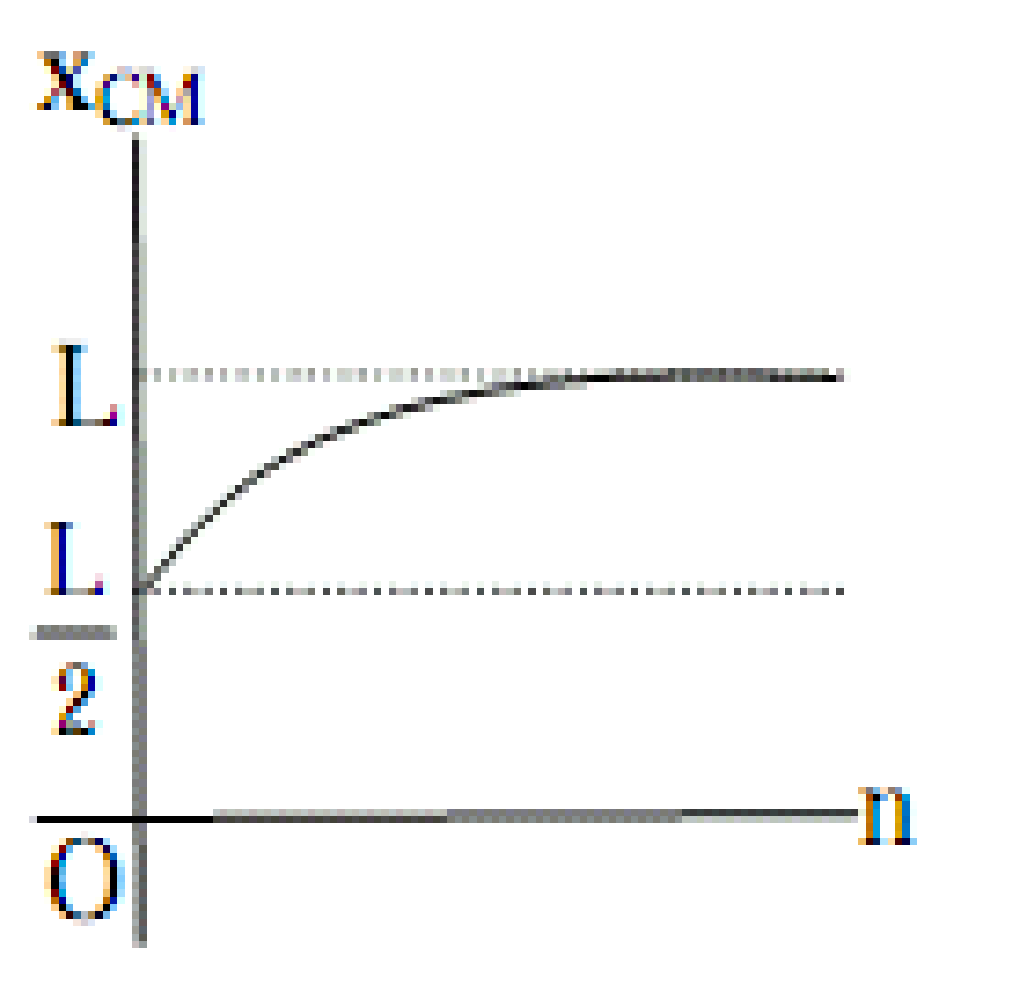
, where n can be zero or any positive number. If the position x CM of the centre of mass of the rod is plotted against 'n', which of the following graphs best approximates the dependence of x CM on n ?
Text Solution
Verified by ExpertsThe correct answer is:
D
Step 1: Consider the linear density \( \lambda(x) = kx^n \) where \( k \) is a constant and \( n \) can be zero or any positive number.
Step 2: The center of mass \( x_{CM} \) for a rod with variable density is calculated using the formula:
\[ x_{CM} = \frac{1}{M} \int_0^L x \lambda(x) \, dx \]
where \( M \) is the total mass given by
\[ M = \int_0^L \lambda(x) \, dx = \int_0^L kx^n \, dx = \frac{kL^{n+1}}{n+1} \]
Step 3: Substituting \( \lambda(x) \) into the center of mass equation leads to:
\[ x_{CM} = \frac{1}{M} \int_0^L x kx^n \, dx = \frac{1}{M} \frac{kL^{n+2}}{n+2} = \frac{(n+1)}{(n+2)L}
Step 4: Analyze the behavior of \( x_{CM} \) as \( n \) increases:
- As \( n \) approaches 0, \( x_{CM} \) approaches \( \frac{L}{2} \) (uniform density).
- As \( n \) increases, \( x_{CM} \) approaches L, as the density becomes more concentrated towards the right end of the rod.
Step 5: The graph showing this trend is a smooth curve that approaches L as n increases, which matches Option D.
Step 2: The center of mass \( x_{CM} \) for a rod with variable density is calculated using the formula:
\[ x_{CM} = \frac{1}{M} \int_0^L x \lambda(x) \, dx \]
where \( M \) is the total mass given by
\[ M = \int_0^L \lambda(x) \, dx = \int_0^L kx^n \, dx = \frac{kL^{n+1}}{n+1} \]
Step 3: Substituting \( \lambda(x) \) into the center of mass equation leads to:
\[ x_{CM} = \frac{1}{M} \int_0^L x kx^n \, dx = \frac{1}{M} \frac{kL^{n+2}}{n+2} = \frac{(n+1)}{(n+2)L}
Step 4: Analyze the behavior of \( x_{CM} \) as \( n \) increases:
- As \( n \) approaches 0, \( x_{CM} \) approaches \( \frac{L}{2} \) (uniform density).
- As \( n \) increases, \( x_{CM} \) approaches L, as the density becomes more concentrated towards the right end of the rod.
Step 5: The graph showing this trend is a smooth curve that approaches L as n increases, which matches Option D.
Prepare Smarter with CGP Edu
Get practice questions, solutions, and test series in one place.
Write a Review
Share your experience with this question and solution.
Commentary
Send your comment, doubt, correction, or feedback to admin.
Similar Questions
Explore conceptually related problems
A circular disc of radius R is removed from a bigger circular disc of radius 2R such that the circu…
A block of mass 0.50 kg is moving with a speed of 2.00 ms –1 on a smooth surface. It strikes anothe…
Statement-1 : Two particles moving in the same direction do not lose all their energy in a complete…
This question has statement Ι and Statement ΙΙ . Of the four choices given after the Statements, ch…
A particle of mass m moving in the x direction with speed 2v is hit by another particle of mass 2m …
Distance of the centre of mass of a solid uniform cone from its vertex is z 0 . If the radius of it…