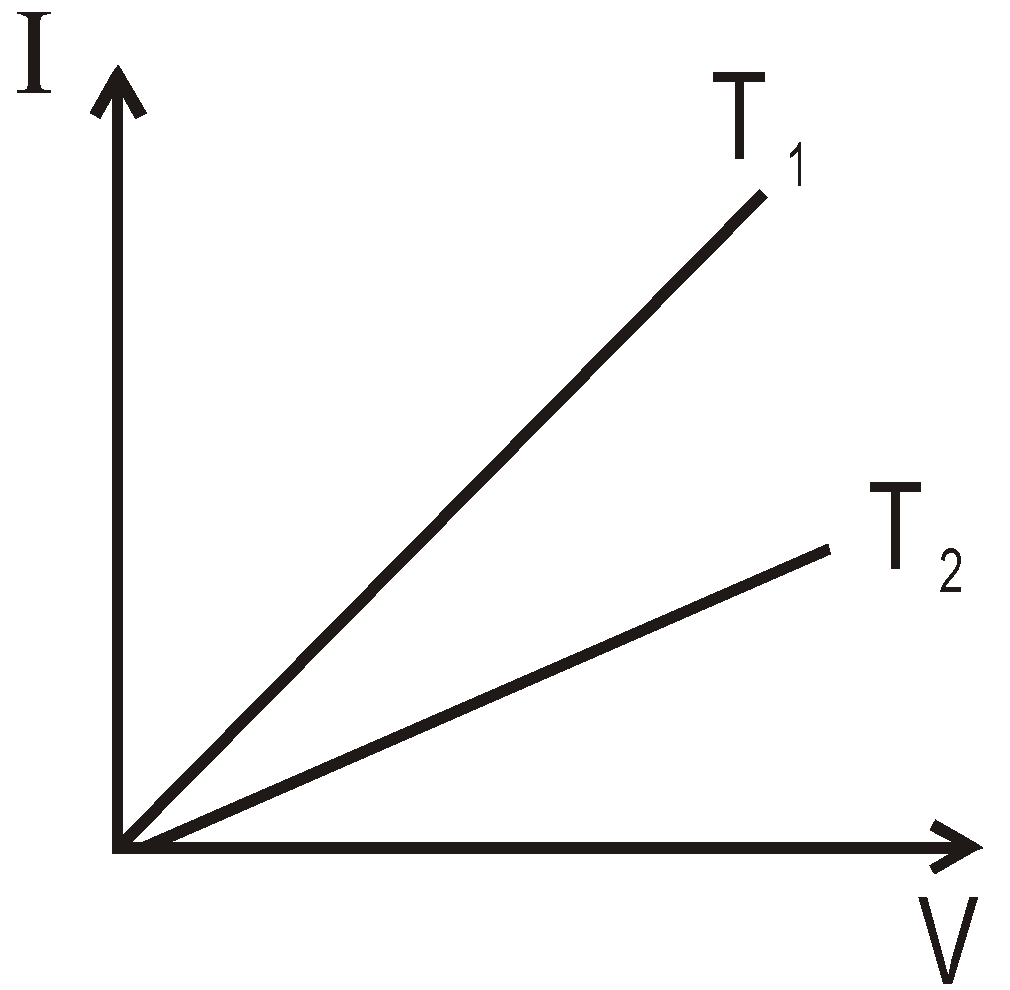
The current-voltage graphs for a given metallic wire at two different temperature T 1 and T 2 are shown in the figure. Which one is higher, T 1 or T 2
Text Solution
Verified by ExpertsThe correct answer is:
CHECK THE SOLUTION.
T 2
Sol.  = slope of given graph =
  or R =
Resistance of a metallic wire increases with increase in temperature.
 <
< 
 >
> 
or  >
> 
or  >
> 
Prepare Smarter with CGP Edu
Get practice questions, solutions, and test series in one place.
Write a Review
Share your experience with this question and solution.
Commentary
Send your comment, doubt, correction, or feedback to admin.
Similar Questions
Explore conceptually related problems
Specific resistance of a wire depends on its
There are two wires of the same length and of the same material and radii r and 2r. The ratio of th…
If the length and cross-section of a wire is doubled, then the resistance will
V-i graph for an ohmic resistance i
When a resistance wire is passed through a die the cross–section area decreases by 1%, the change i…
When the resistance of copper wire is 0.1 Ω Ω and the radius is 1 mm, then the length of the wire i…