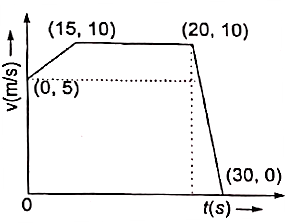
The figure shows the velocity-time graph of a cyclist who moves along a straight line
tarting with velocity of  , and coming to rest at
  . Choose the incorrect option.
A
Distance traveled by the cyclist is 212.5 m.
B
Distance covered by the cyclist when it moves with constant velocity is 100 m.
C
Velocity of the cyclist at  is
is  .
.
is . D
Acceleration at  is zero,
is zero,
Text Solution
Verified by ExpertsThe correct answer is:
B
No detailed text explanation provided yet.
Prepare Smarter with CGP Edu
Get practice questions, solutions, and test series in one place.
Write a Review
Share your experience with this question and solution.
Commentary
Send your comment, doubt, correction, or feedback to admin.
Similar Questions
Explore conceptually related problems
The displacement-time graph for the two particles A and B are straight lines inclined at angles 30 …
The variation of velocity of a particle moving along straight line is shown in figure. The distance…
The adjoining curve represents the velocity-time graph of a particle, its acceleration values along…
The velocity-time graph of a linear motion is shown below. The displacement from the origin after 8…
The following figures show some velocity V versus time t curves. But only some of these can be real…
A rocket is projected vertically upwards and its time velocity graph is shown in the figure. The ma…