Published by:
CGP EDU Academic Team
Published on: September 12, 2026
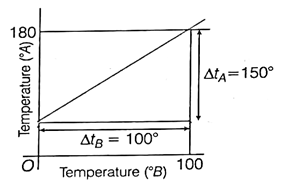
The graph between two temperature scales  and
and  as shown in figure. Between upper fixed point and lower fixed point, there are 150 equal divisions on scale
  and 100 on scale
  . The relationship for conversion between the two scales is given by
A

B

C

D

Text Solution
Verified by ExpertsThe correct answer is:
B
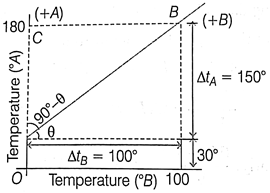
It is clear from the graph that lowest point for scale  is
is  and lowest point for scale
  is
is  . Highest point for the scale
  is
is  and for scale
  is
is  .
.
Hence, correct relation is

where,  lower fixed point
and  upper fixed point

Prepare Smarter with CGP Edu
Get practice questions, solutions, and test series in one place.
Write a Review
Share your experience with this question and solution.
Commentary
Send your comment, doubt, correction, or feedback to admin.
Similar Questions
Explore conceptually related problems
Two rods of different materials having coefficients of thermal expansion and Young's moduli respe…
A steel rod of diameter 1 cm is clamped firmly at each end when its temperature is , so that it ca…
The coefficient of linear expansion of crystal in one direction is and that in other two direction…
On heating a liquid having coefficient of volume expansion in a container having coefficient of li…
A glass flask of volume is just filled with mercury at . The amount of mercury that will overflow…
How much heat energy is gained when 5 kg of water at is brought to its boiling point,
(Specific he…