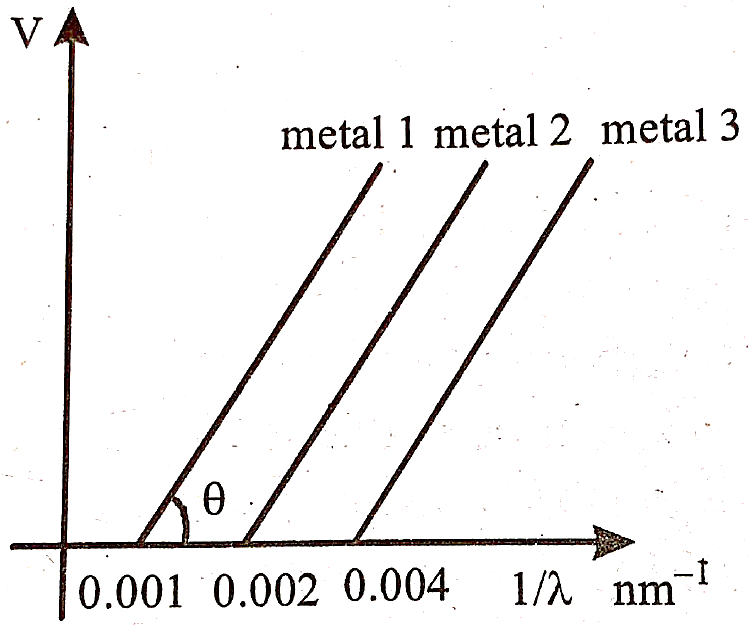
The graph between  and stopping potential (V) of three metals hvaing work functions
  and
and  in an experiment of photo-electric effect is plotted as shown in the figure, Which of the following statement(s) is/are correct? [Here λ is the wavelength of the incident ray]
A
Ratio of work functions 
B
Ratio of work functions 
C
 is directly proportional to hc/e, where h is Planck's constant and c is the speed of light.
 D
The violet colour light can eject photoelectrons from metals 2 and 3 .
Text Solution
Verified by ExpertsThe correct answer is:
C
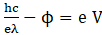

For plate 1:

Plate 2

Plate 3


For plate 2, threshold wavelength-

For plate 3, threshold wavelength

since violet colour light λ is 400 nm, so  for plate 2
so, violet colour light will eject photo-electrons from plate 2 and not plate 3.
Prepare Smarter with CGP Edu
Get practice questions, solutions, and test series in one place.
Write a Review
Share your experience with this question and solution.
Commentary
Send your comment, doubt, correction, or feedback to admin.
Similar Questions
Explore conceptually related problems
PHYSICS
SINGLE CORRECT MCQ
Statement I: If the temperature of a semiconductor is increased then it'…
The energy equivalent of 0.5 g of a substance is:
A wheel of radius 0.4 m can rotate freely about its axis as shown in the figure. A string is wrappe…
If the ratio of lengths, radii and Young's modulus of steel and brass wires shown in the figure are…
A magnetic needle suspended parallel to a magnetic field requires of work to turn it through . Th…
The magnetic induction at the center O in the figure shown is